FINANCIAL FORECASTING MADE EASY
How I helped Financial Advisors to easily keep track of their client’s financial data and educate them on how they can prepare for their future.
The project's goal was to conduct a heuristic evaluation and expert analysis on a legacy financial services application. The heuristic is planned to be used as a guide to avoid past mistakes and retain successful elements in the previous application. The evaluation was conducted by me, following a set of widely accepted standards for heuristic analysis. The document also includes a review of specific components in the application and includes descriptions and explanations on why a particular component can be changed and what the value of the change would be. A big part of this documentation talks about utilizing perception and cognition in making a design more usable for users but the document also tackles in-depth and fundamental changes in the actual architecture of the application and advices the company to consider reviewing the past structures and observe newer ways to streamline experiences for users.
THE PROBLEM
Because of the difficulty of the company’s current app experience, data input in order to create projections for a financial advisor’s client’s financial readiness for their future has become cumbersome and usually leads to fall-offs in terms of app usage of the financial advisor or fall-offs from their customers.
KICK-OFF AND WORKSHOP
Learning more about the financial advisors, the business, and the problem.
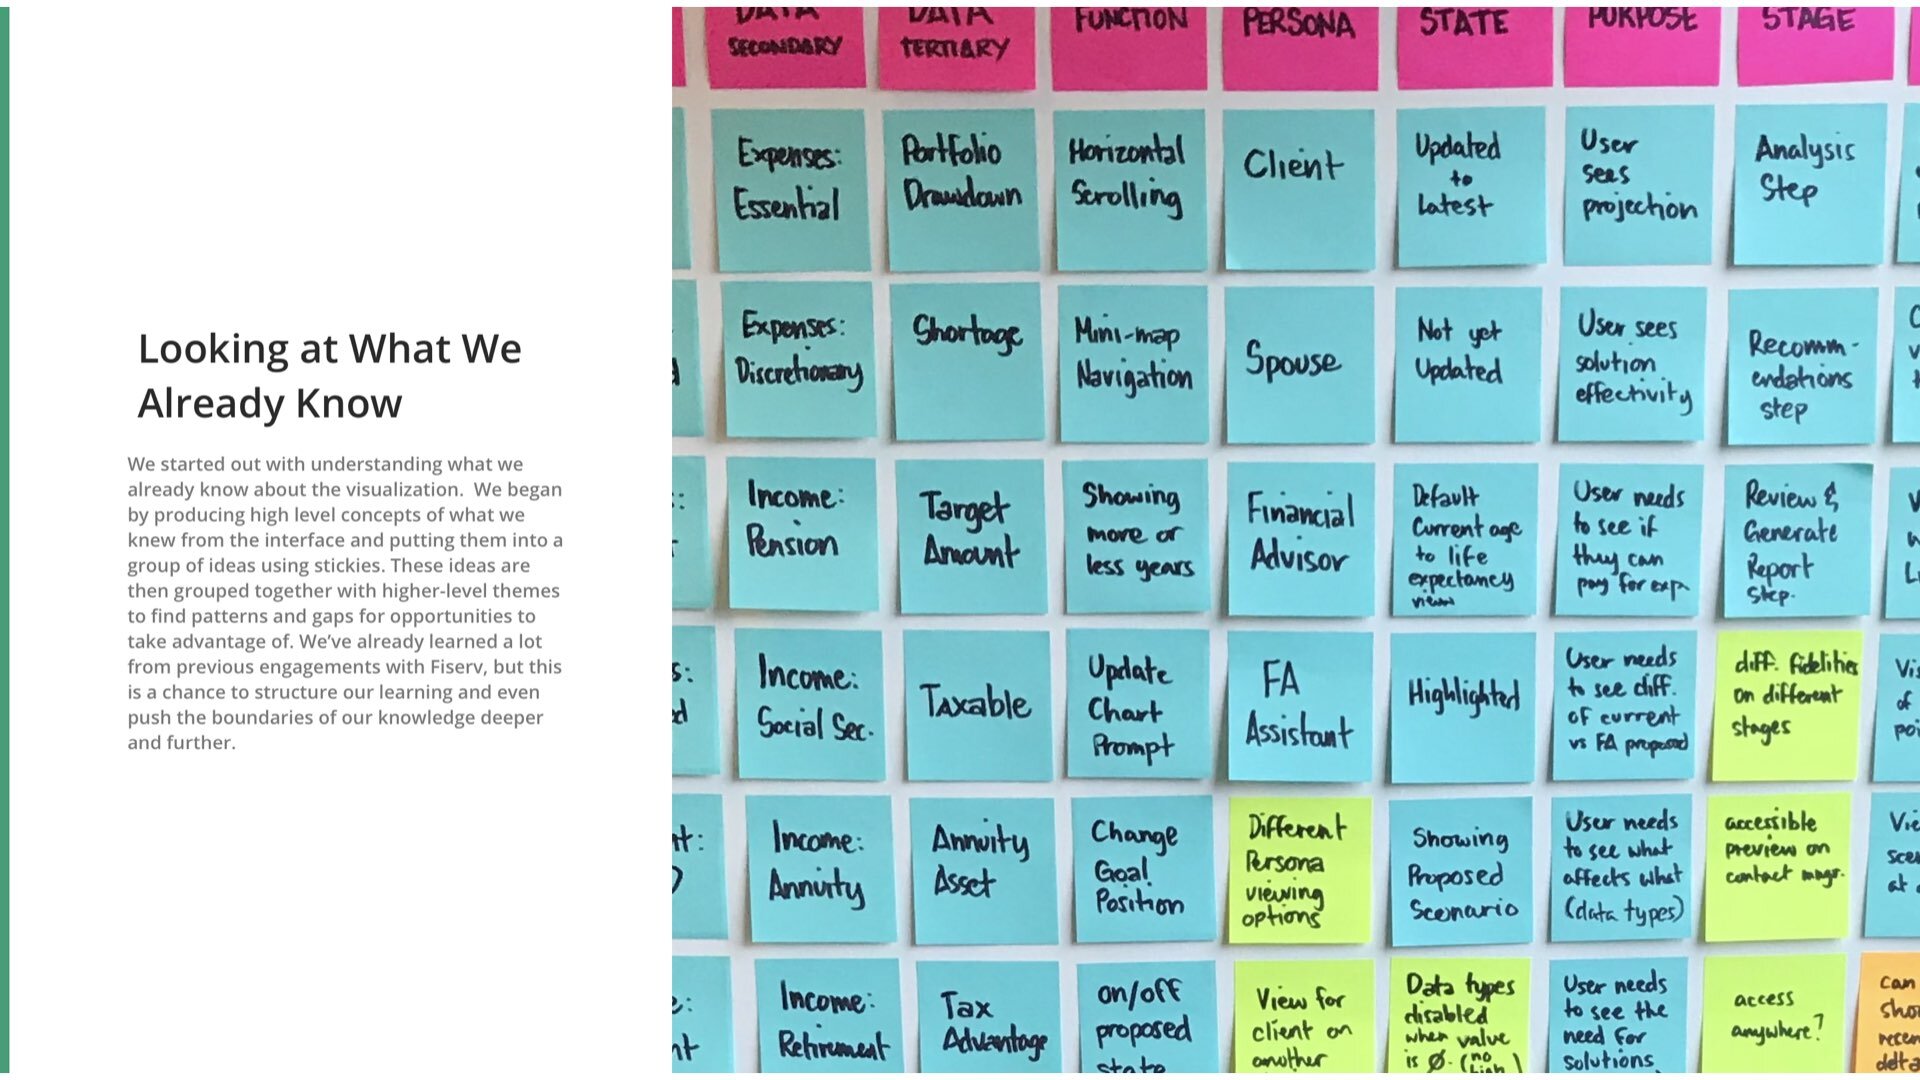
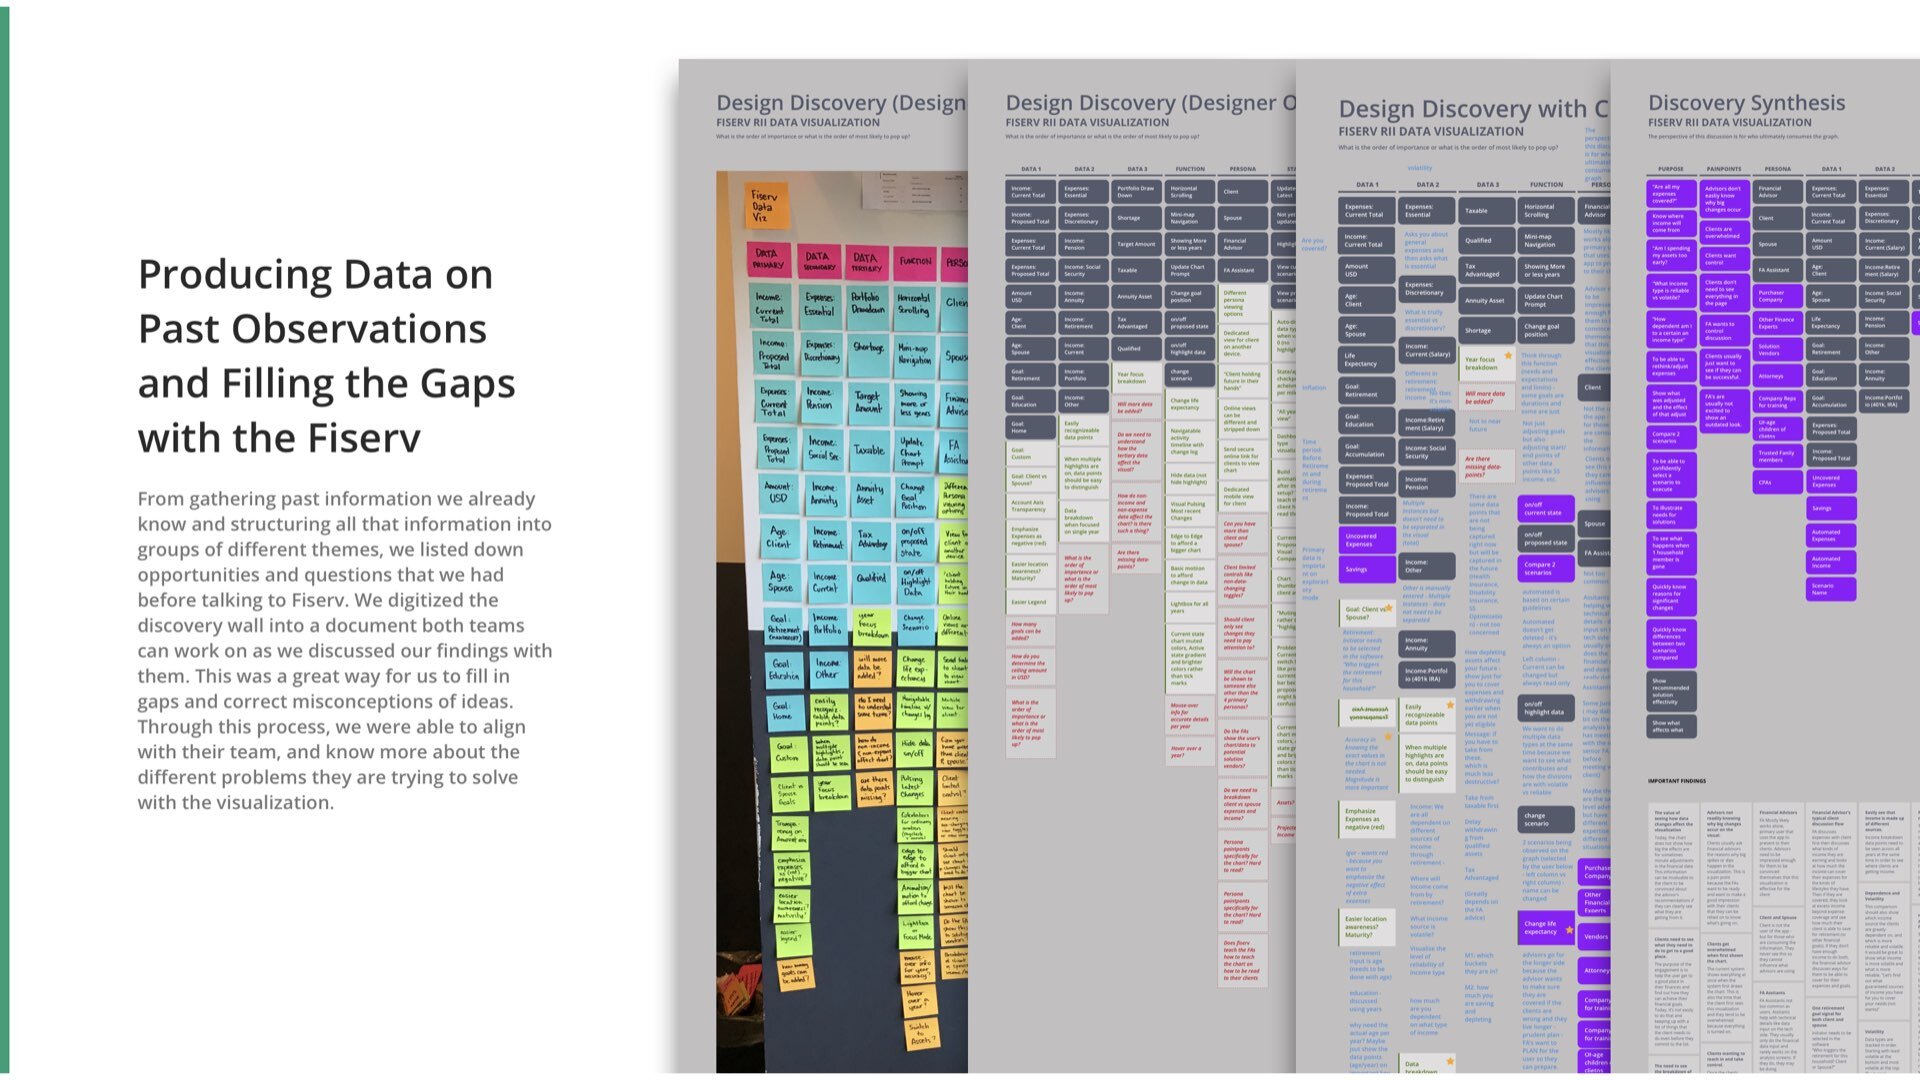
I conducted a single data workshop where we talked about the team’s problems and how they interpreted the data that they gathered that lead them to their conjectures. We did activities such as empathy mapping, post-ups, mock-interviews , user and customer goals and tasks walk-throughs, discussing their pain-points and further expounding on the concepts, to simulate what it's like to be in the shoes of their users and customers and we also used the time in assessing what we will be doing next.

ON-STIE WORKSHOP
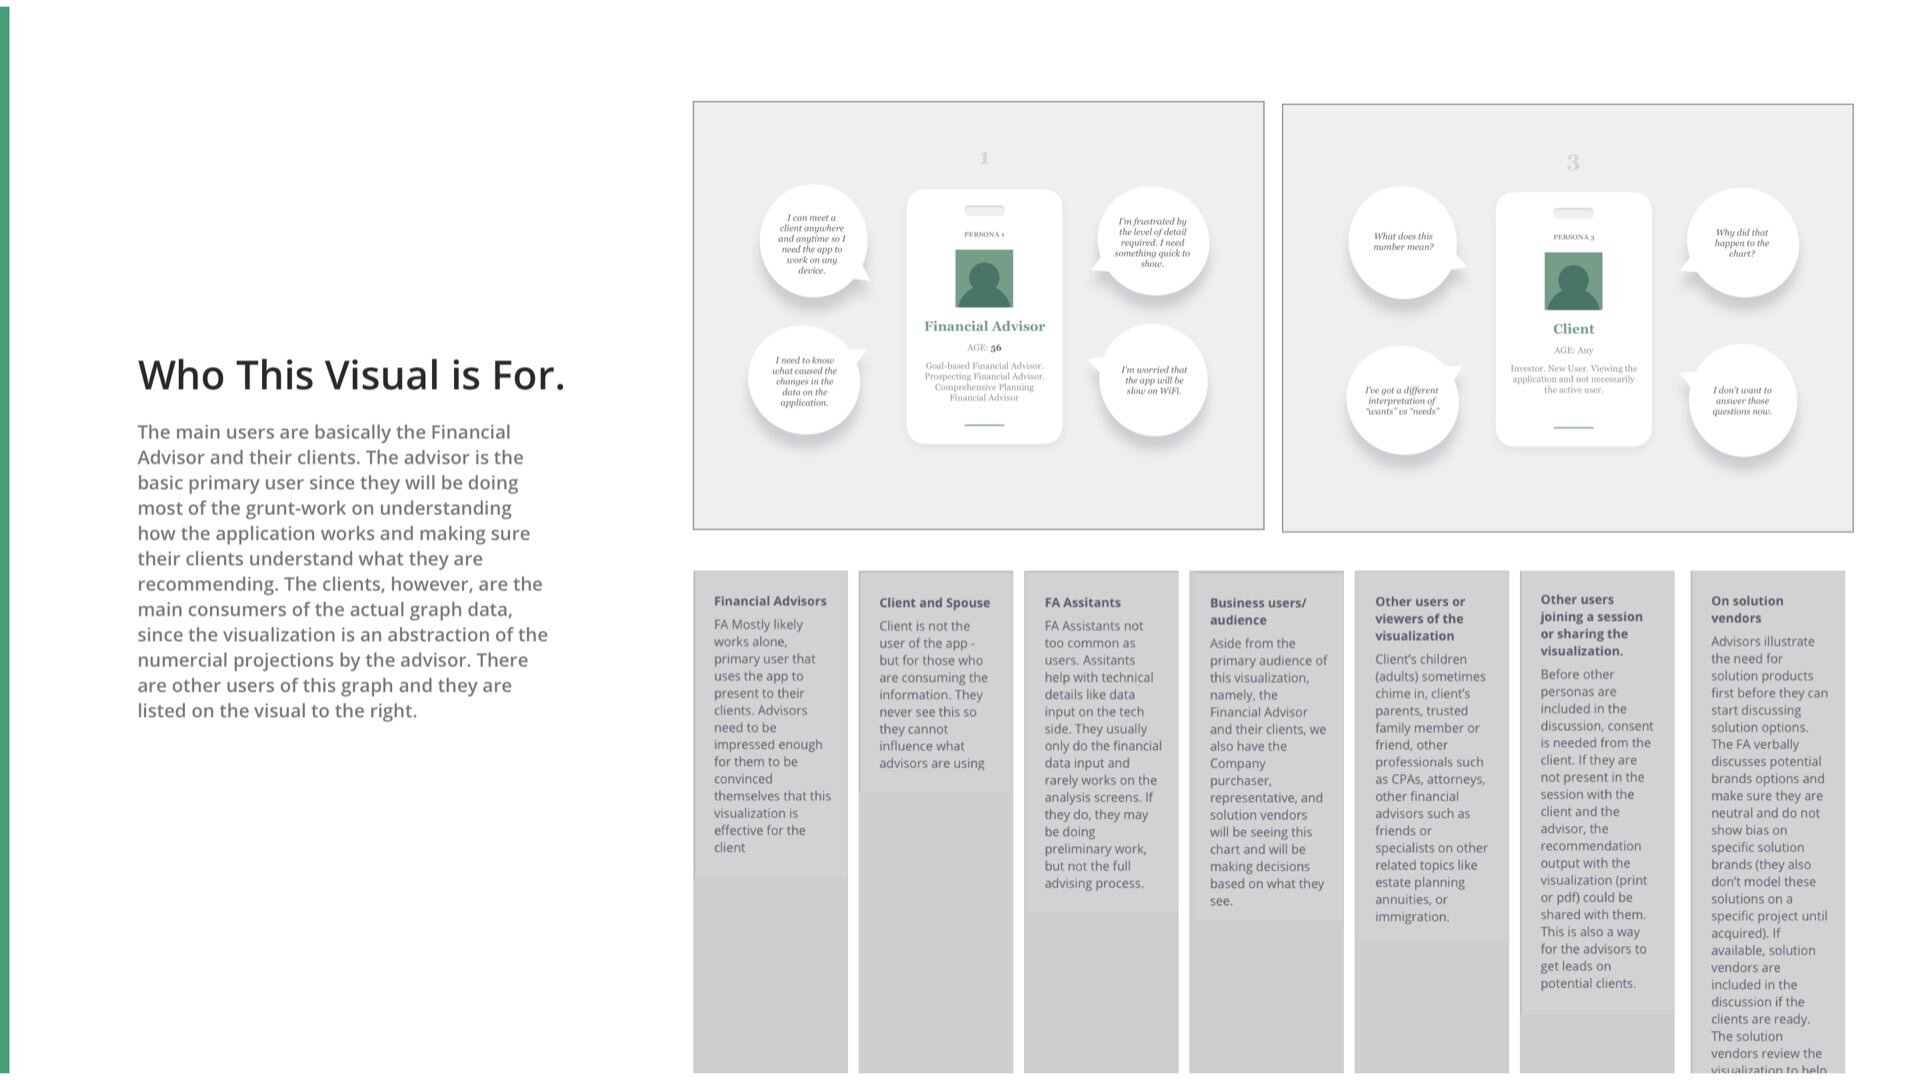
The entire evaluation was based on the development of particular personas that use the service heavily. Building the personas required collaboration during design workshops. This drove a lot of the more fundamental recommendations and also was core to looking at the application from a an SME perspective.

BUILDING PERSONAS
The entire evaluation was based on the development of particular personas that use the service heavily. Building the personas required collaboration during design workshops. This drove a lot of the more fundamental recommendations and also was core to looking at the application from a an SME perspective.

EVALUATION PLANNING
Heuristic evaluations and expert analysis can be done in so many different ways and the key is to find the right method of story telling per type of client it's presented to. Before moving into the actual evaluation process, strategic planning was done in order to tackle the most important and valuable touch points with the time available.
HEURISTIC EVALUATION
I conducted a methodical review of their current application’s experience and compared it against usability heuristics and standards to find opportunities for improvement.
The heuristic evaluation section of the document provides a description of the actual heuristic being tested and a quick over-all summary of how the application fairs to the standard. The document also breaks down each section to show more specific evidence of why a heuristic's score has fallen. After a brief description of the reasoning, the document also provides recommendations on how to improve the issues. This recommendation worked as a way for our team to communicate what was needed for the application. A final heuristic score was given after the evaluation and is based on the level of compliance on each heuristic item. The heuristic score looks at fundamental concepts that encompass the entire application and not just components and provides a quantitative view of how the system performs in terms of usability standards.


VISUAL DESIGN EXPERT ANALYSIS
After reviewing the fundamentals, the problem was also discovered on how they use their design to help perception and cognition for users to have an easier experience in completing app-based tasks.
This section in the document provides information on what components of the application could use an overhaul in the visual design. The document talks about how visual design can be utilized to exploit human tendencies through cognition and perception and how visual cues improve the overall experience of a user because of the improved rate of consuming information.


UI AND USABILITY REVIEW
Interaction and general usability conventions were also reviewed and provided with recommendations.
This section discusses how their application can improve the over all user experience by utilizing standards and best practices for particular interaction elements being used in the application. This section provides explanations on why a UI element might be used incorrectly and recommends ways to approach solving the problem.


COPY AND LANGUAGE
This section discusses how copy and language can help improve a user's experience with an interface. Copy and language adds a human factor and helps connect users with the design.

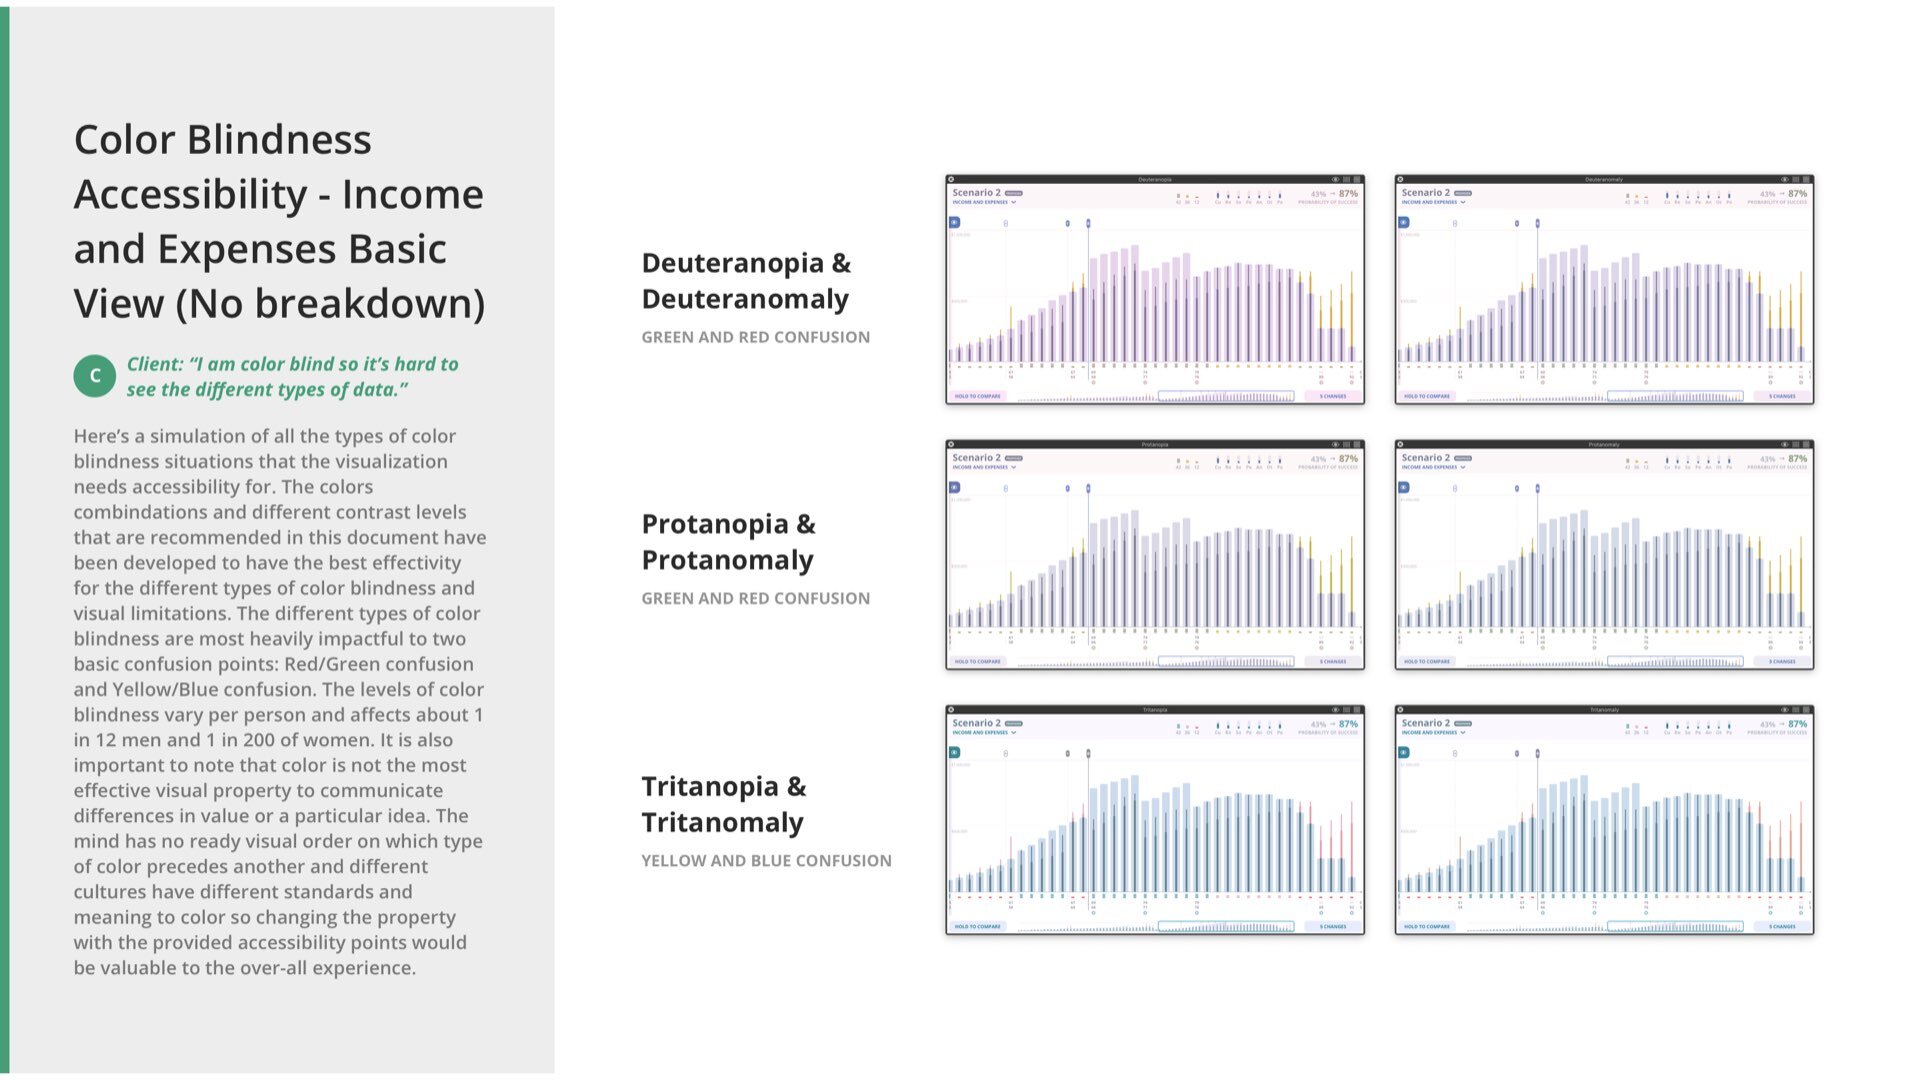
COMPATIBILITY AND ACCESSIBILITY
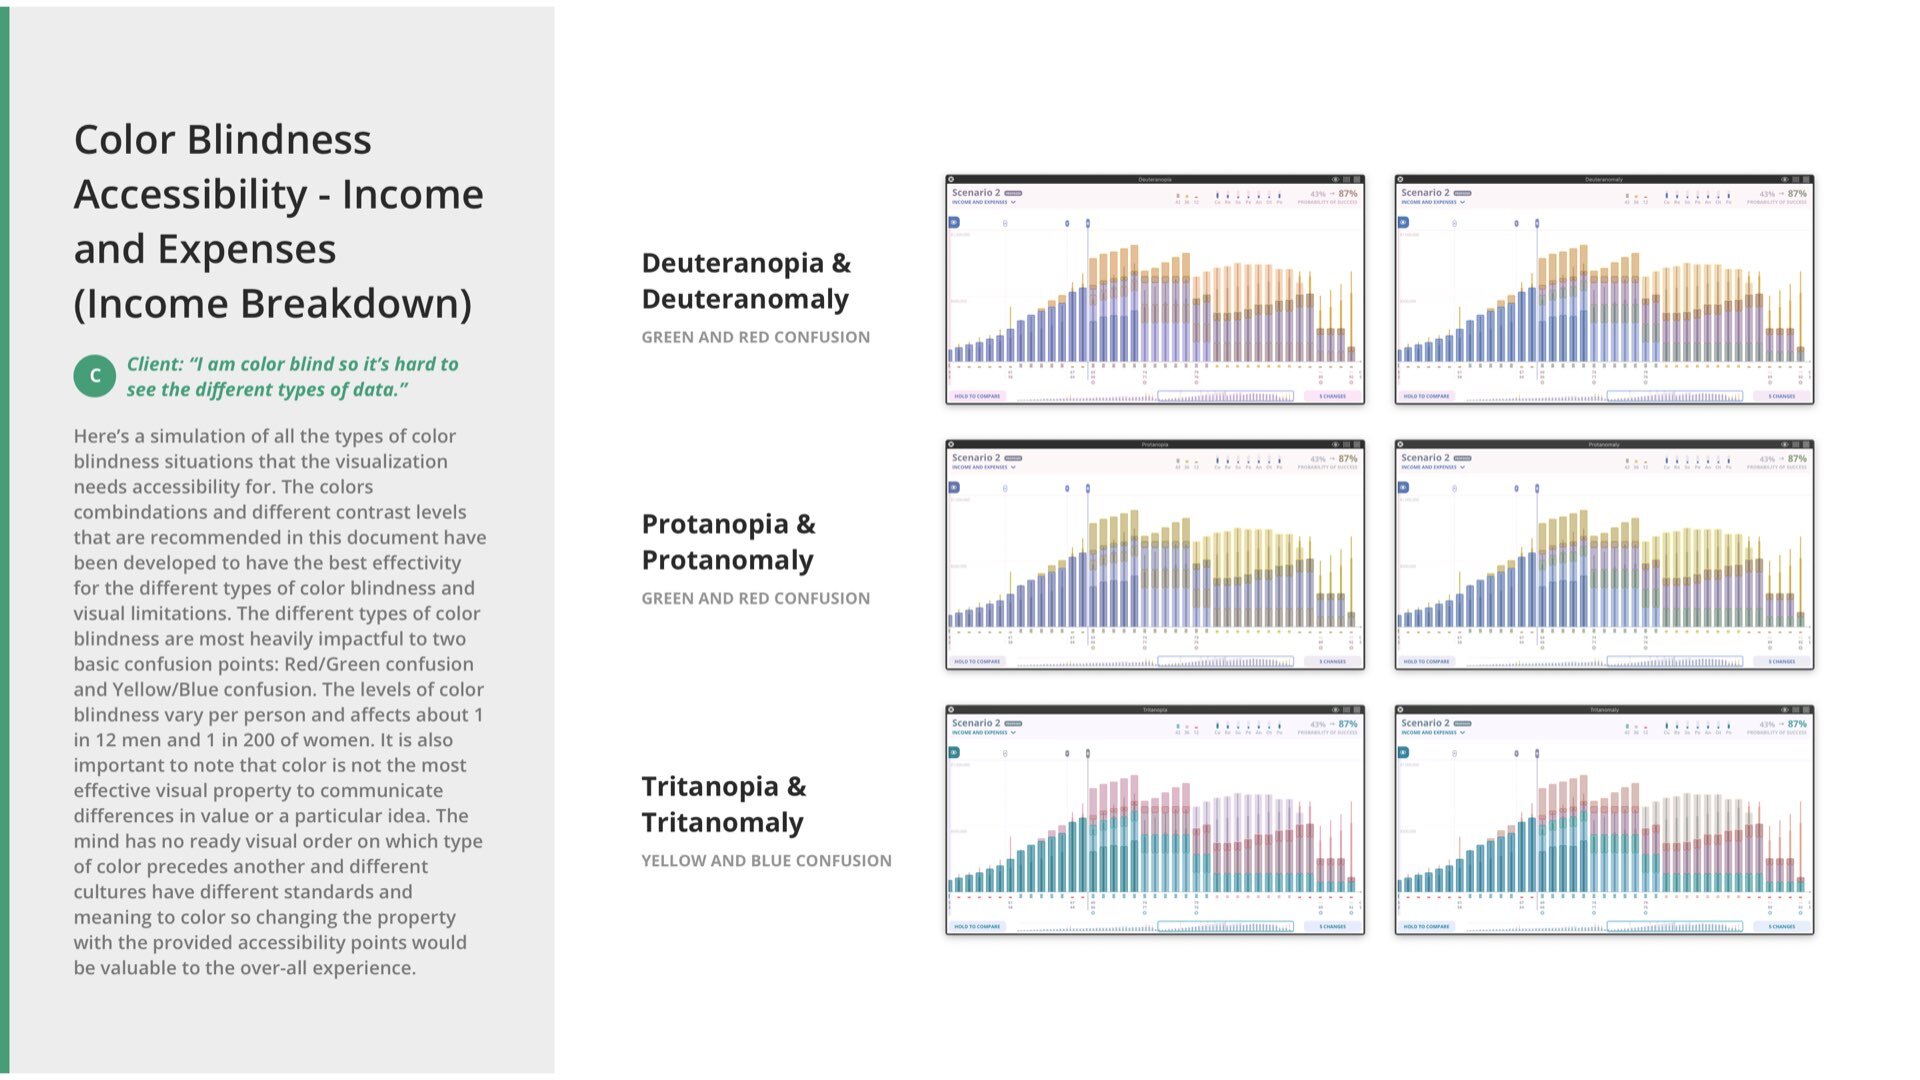
This section discusses the importance of compatibility and accessibility in any application and how it can be a hindrance for users to reach their application goals because of this.

CLARITY AND CONTROL
This section takes a look at the level of clarity a particular page shows and the range of controls a user can have to manipulate the information they are viewing to their preferences
IN-DEPTH RECOMMENDATIONS
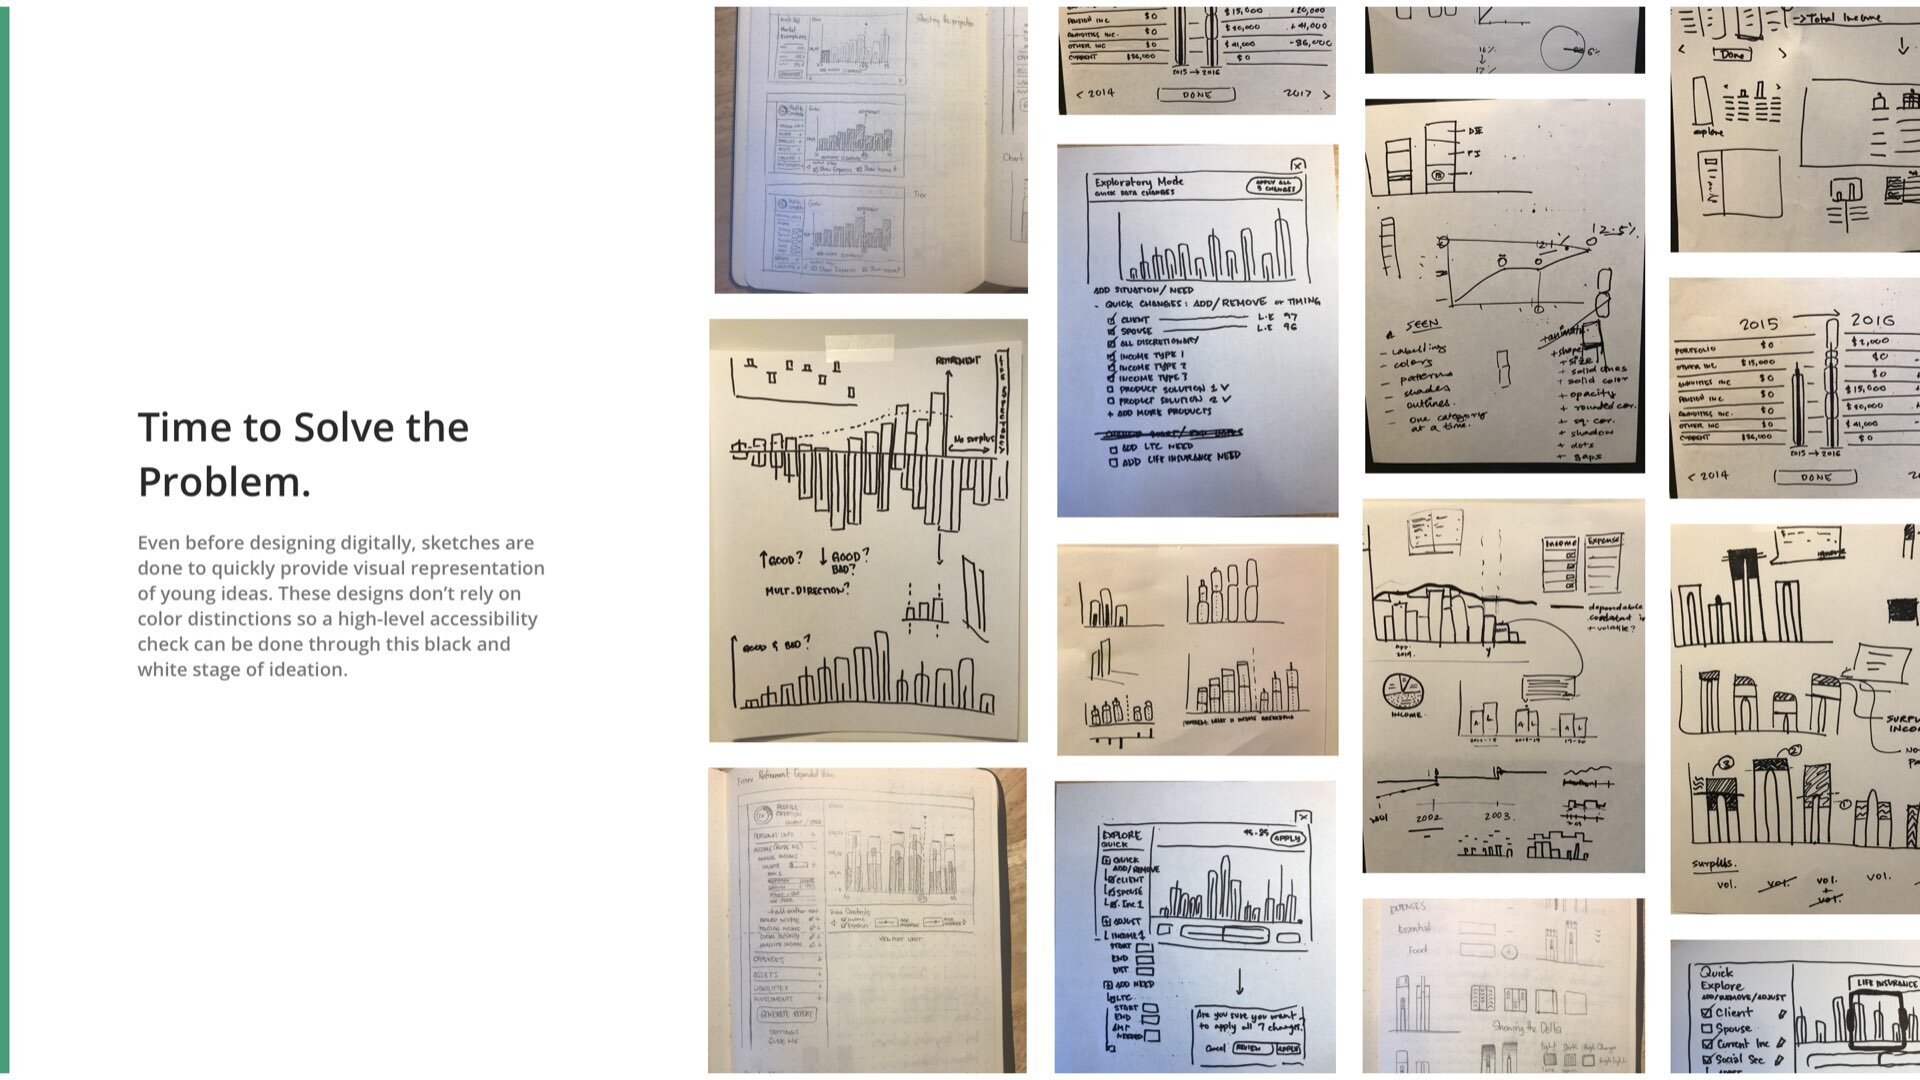
I provided larger experience recommendations such as quick-entry modes and better ways to navigate hundreds of input fields to address fundamental pain-points of users.
This section provides visual ideas of how the application can be improved. Each example tackles a particular concept in the design of the application that can solve issues present in the legacy version. From simple visual design ideas, to more complex fundamental recommendations on changing structures and architecture, this section attempts to provide enough information for the client to know the priorities on what aspects of the redesign needs more attention, and why these improvements are going to be beneficial to their application and the experience of their users.


EXPERIENCE BRIEF
The idea: Remove the front-load data input before the projection and have both side by side. As the user inputs data, a fraction of the projection can be calculated and displayed.
So much of the work is done upfront before anything can be calculated. There is no clear value to how much data input is needed to ensure a more accurate projection, that is why we think the users work less in updating their system or postpone it and have their assistants do it for them (all aside from the UX/UI problems that could be solved at this point). If the user knows that each data point actually contributes to the prediction, then the likelihood of user engagement is higher. And as a bonus, since the chart is being built each time an input field is filled, the user and their customers can easily determine how to read the projection as they work with it from an empty state to a full state.

ONLY FOUR DAYS TO PROTOTYPE
With the data input experience, side-by-side with the projection builder, the financial advisor could feel the value of the work that they are doing and their customers could start learning how to read the projection from simple to complex at the same time.
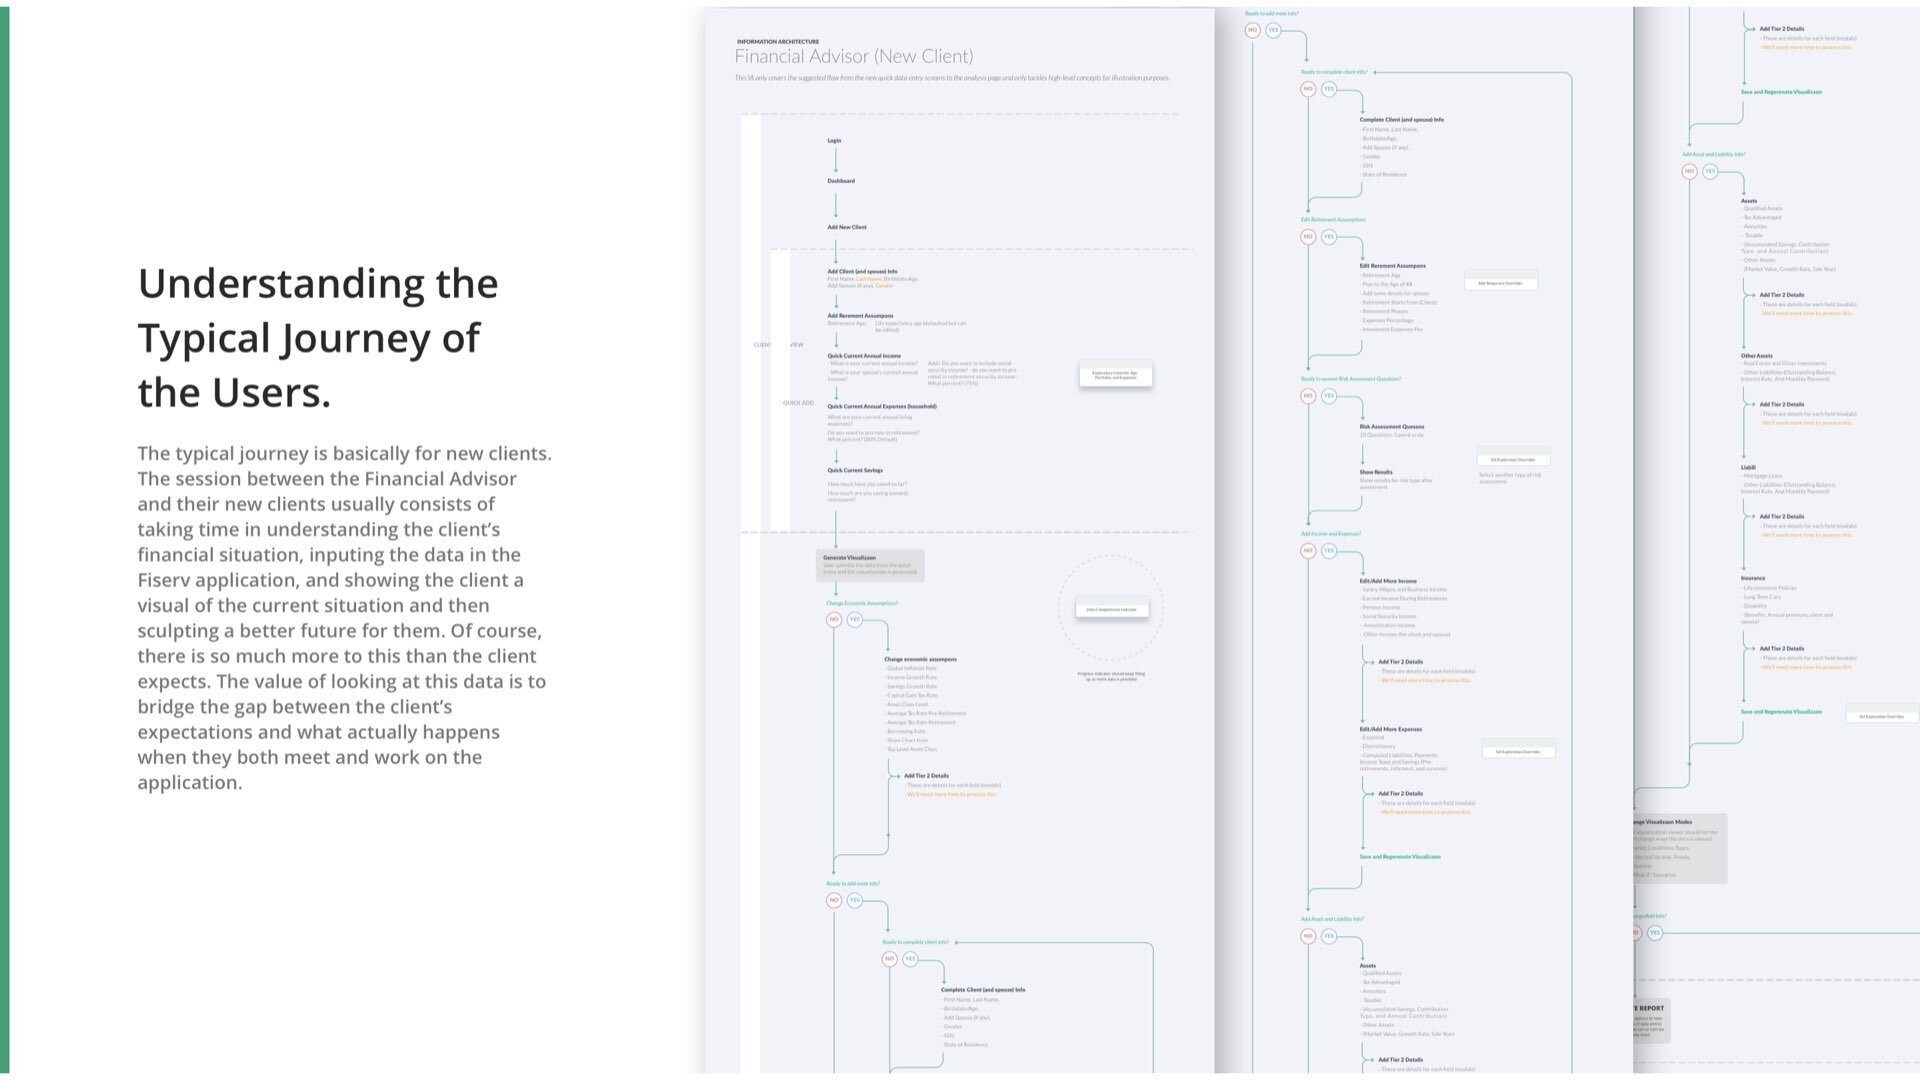
After the evaluation, we were given just about 4 days to produce a wireframe prototype of an idea that came out of the heuristic. This was a challenge, but I've managed to create an entire narrative that would demonstrate the new and improved experience of their application. The original application required the user to put all their financial information in one go before any kind of analysis was given. We suggested the approach to be more conversational, and use progressive disclosure on the first parts or building the graph and onboarding the user to the application.
The experience starts off with the financial advisor going through a series of client-onboarding questions that ask simple and approachable questions to ease their clients into the experience. As they add these data points, the chart on the right would then slowly start building with additional data points. This would give the financial advisor motivation to keep adding more granular data points to their user’s financial profile as they see the value it is adding to the accuracy and specificity of the model on the right. At the same time, their customers wouldn’t have to dive in and be overwhelmed with multi-variate data graphs about their future projections as they would be along for the ride with their advisors from the time the graph gets built from it’s simplest form to it’s most powerful levels.


QUICK ADD CONCEPT
The first application required the user to put all their financial information in one go before any kind of analysis was given. We suggested the approach to be more conversational, and use progressive disclosure on the first parts or building the graph and onboarding the user to the application. It was also a great way to add helpful notes every step of the way.

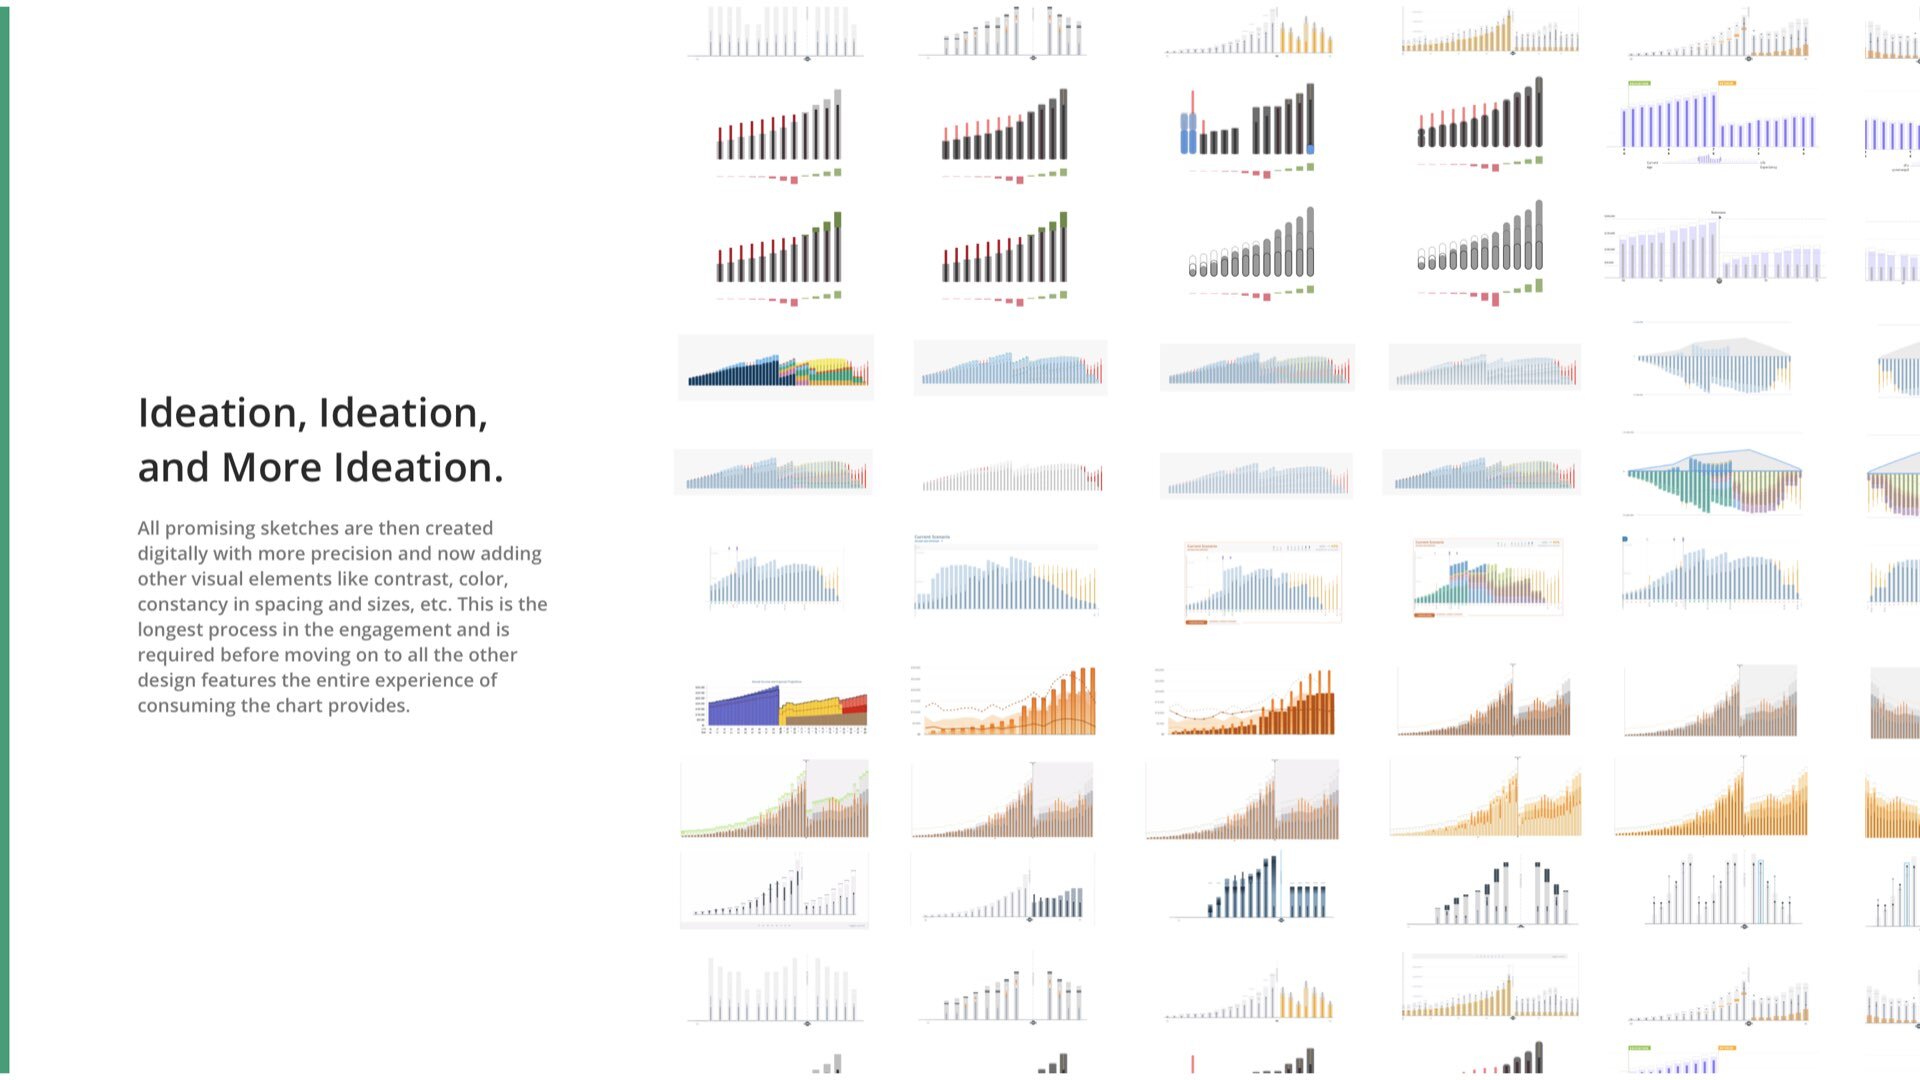
VISUALIZATION EXPLORATION
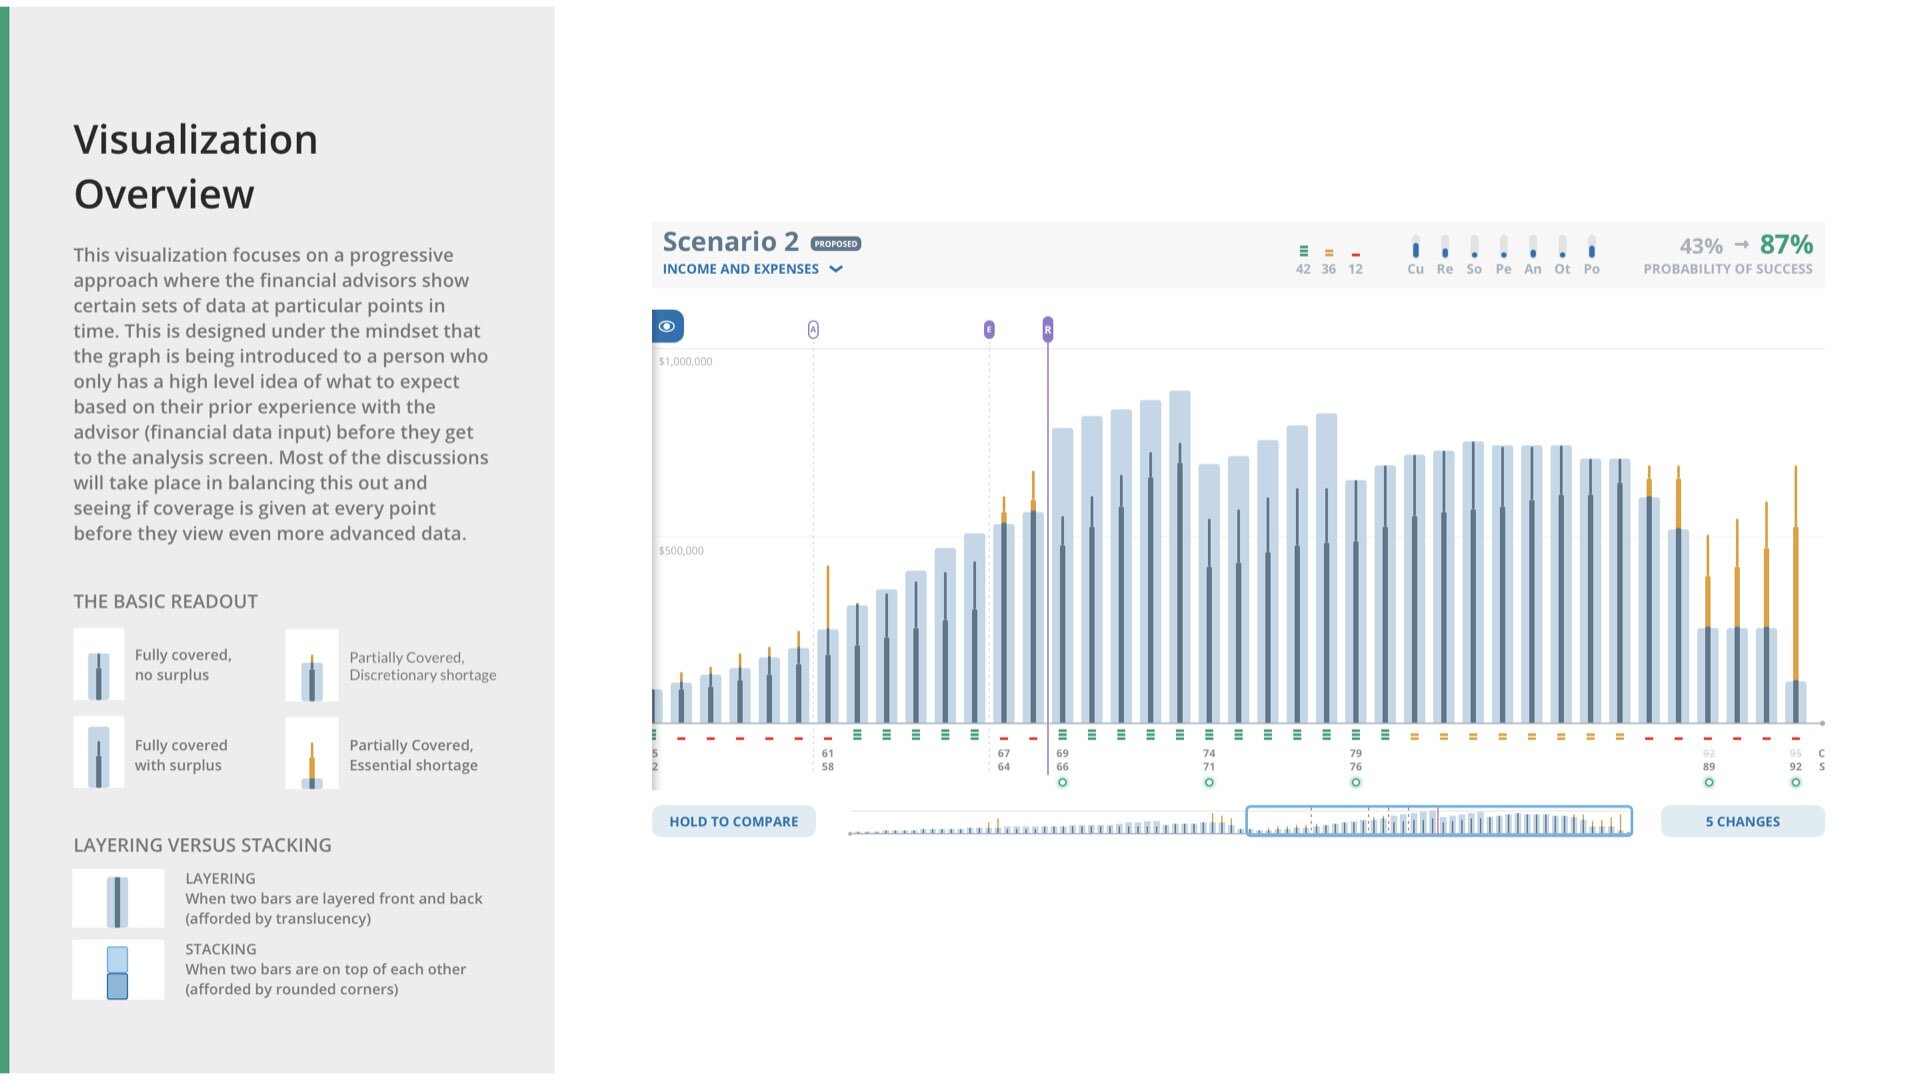
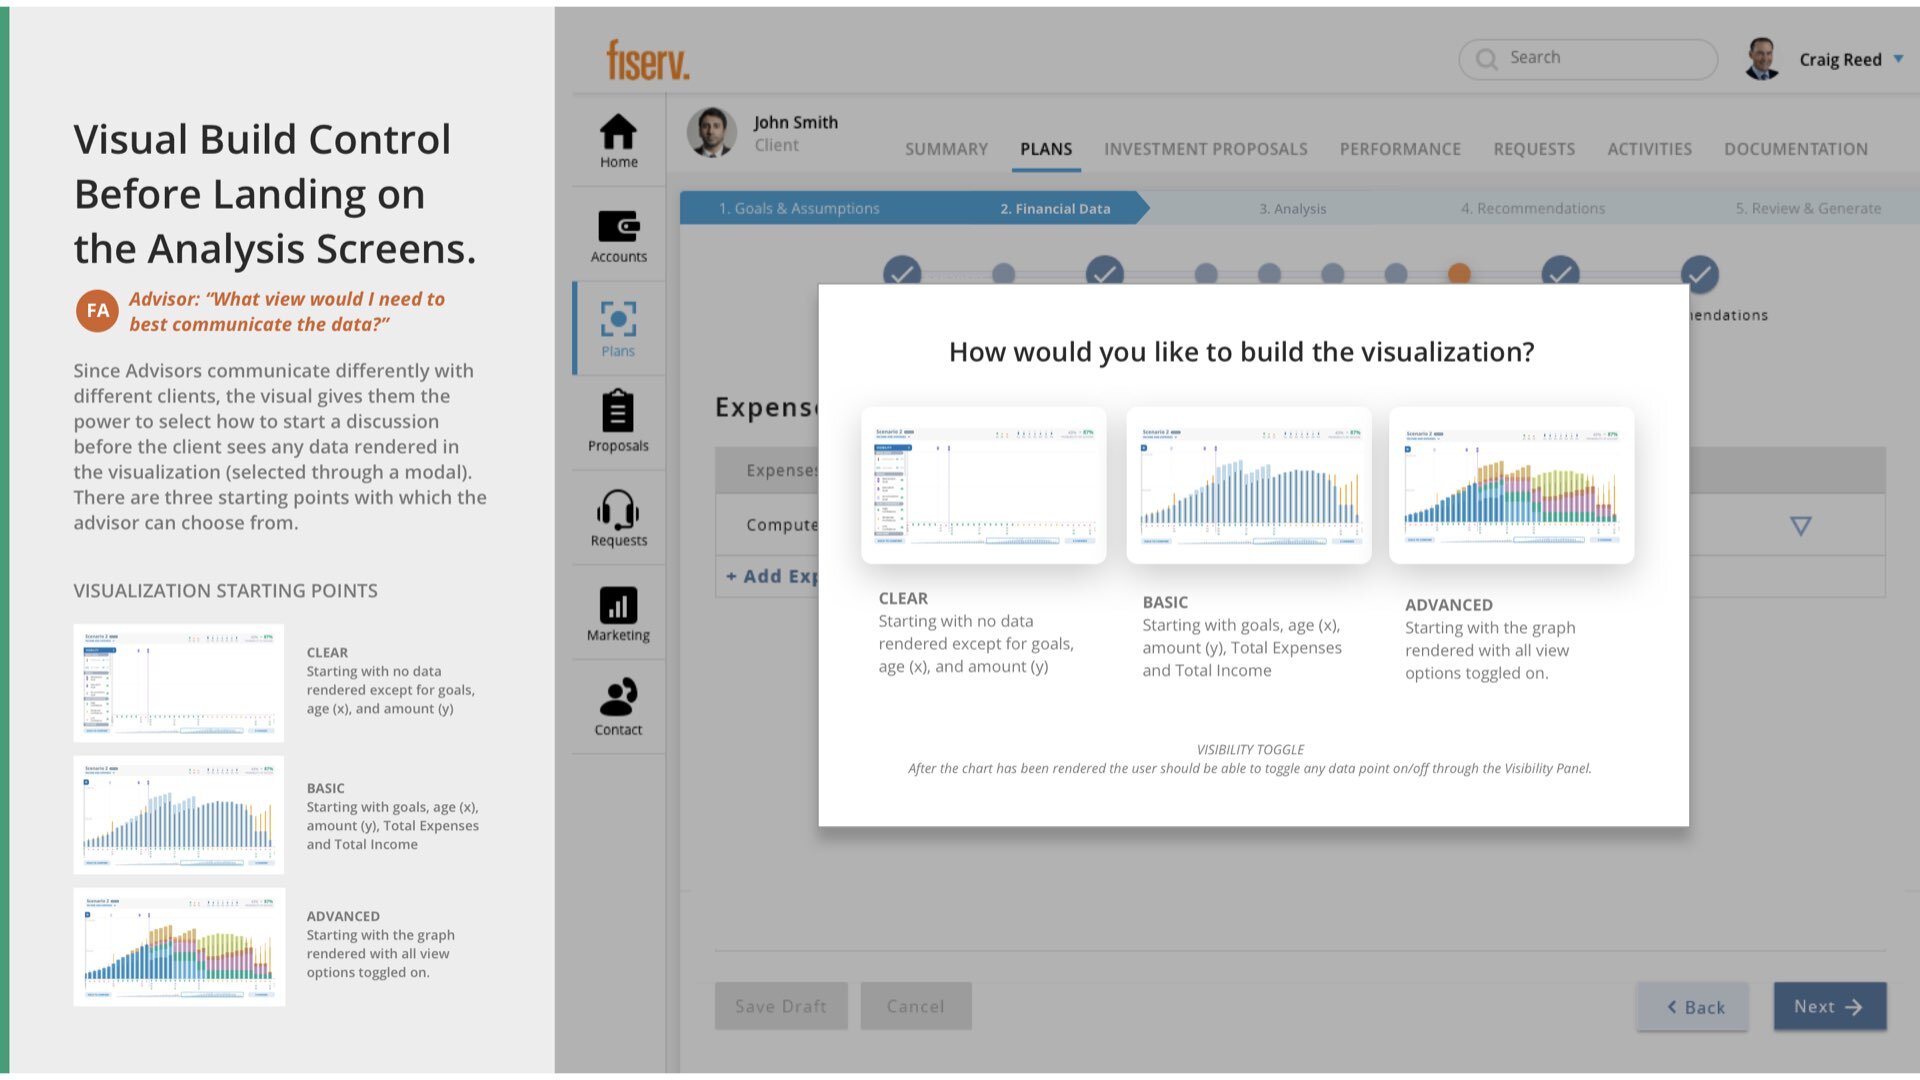
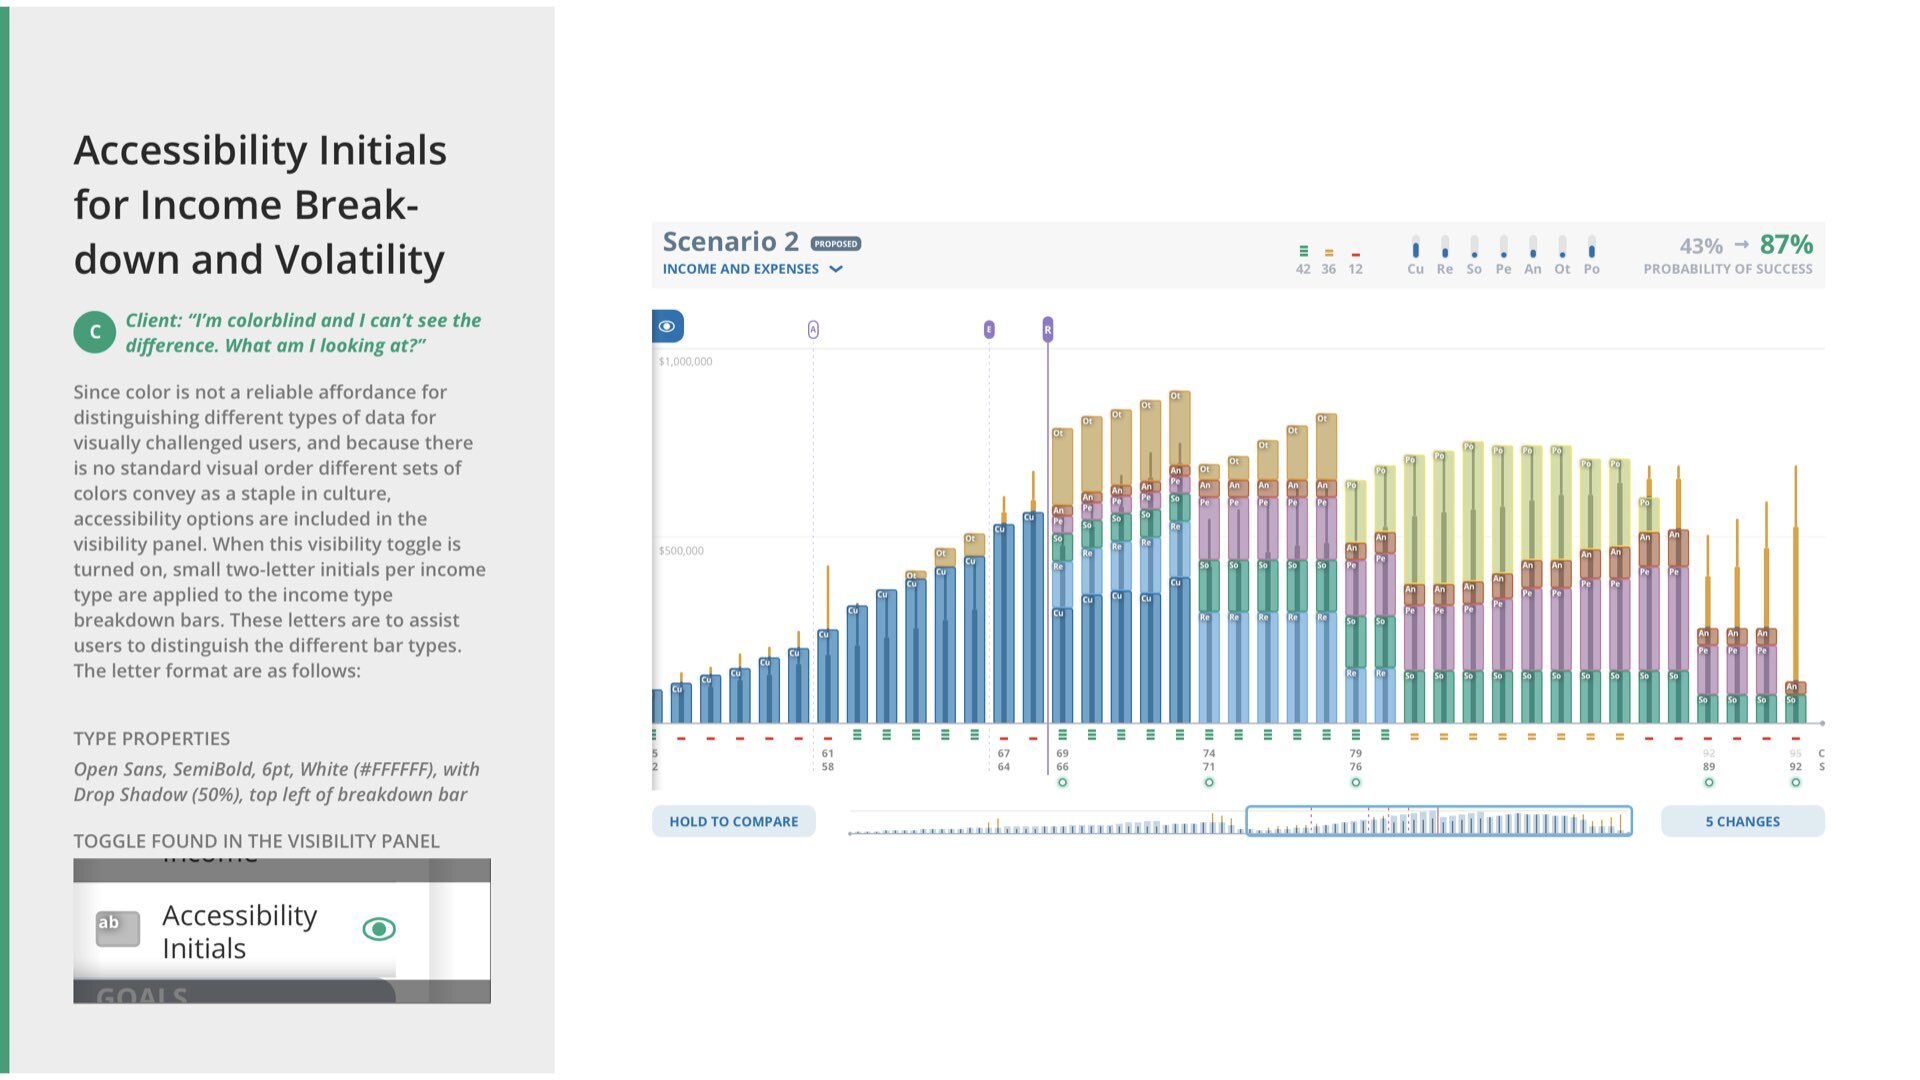
We created multiple iterations of a visualization to cover the client needs and still keep visualization standards in check during our exploration of this feature. The visual is probably the centerpiece of the application, where most of the analysis and decision making becomes most valuable.

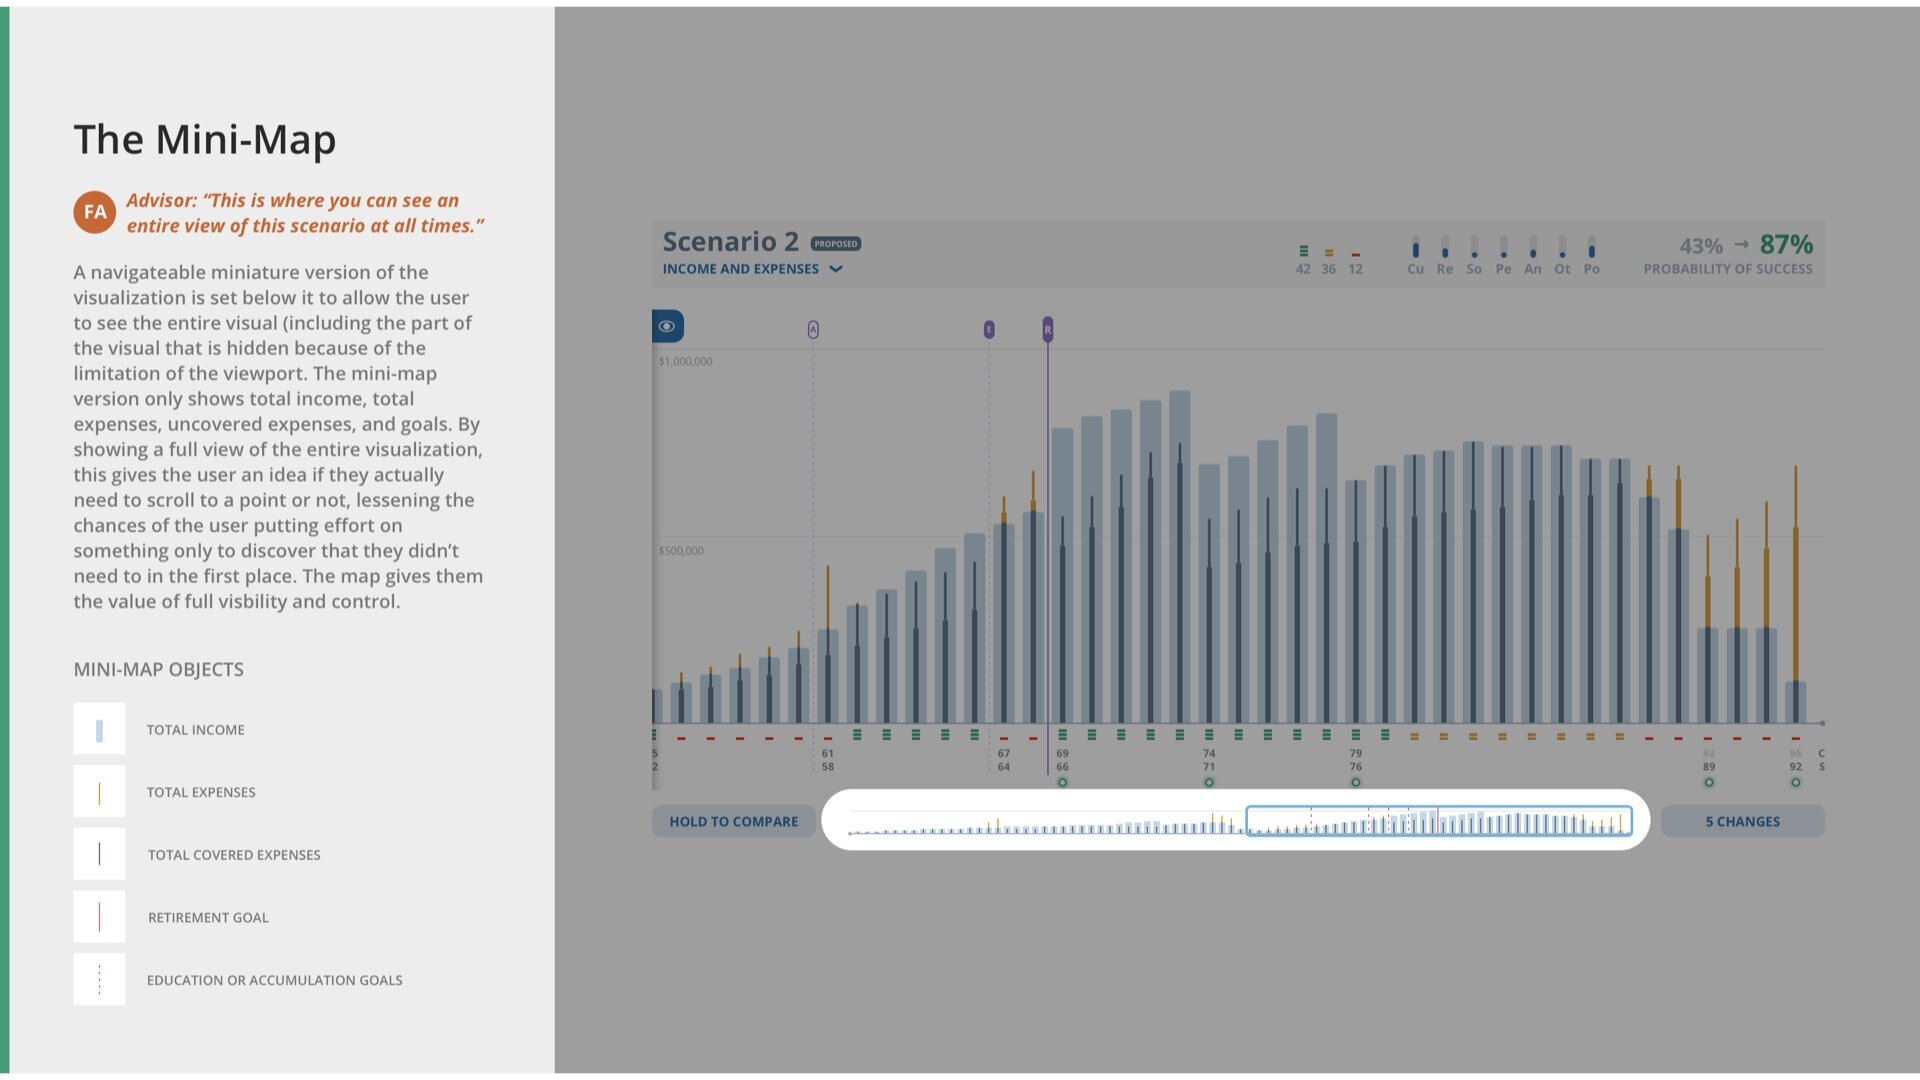
VISUALIZATION MINIMAP
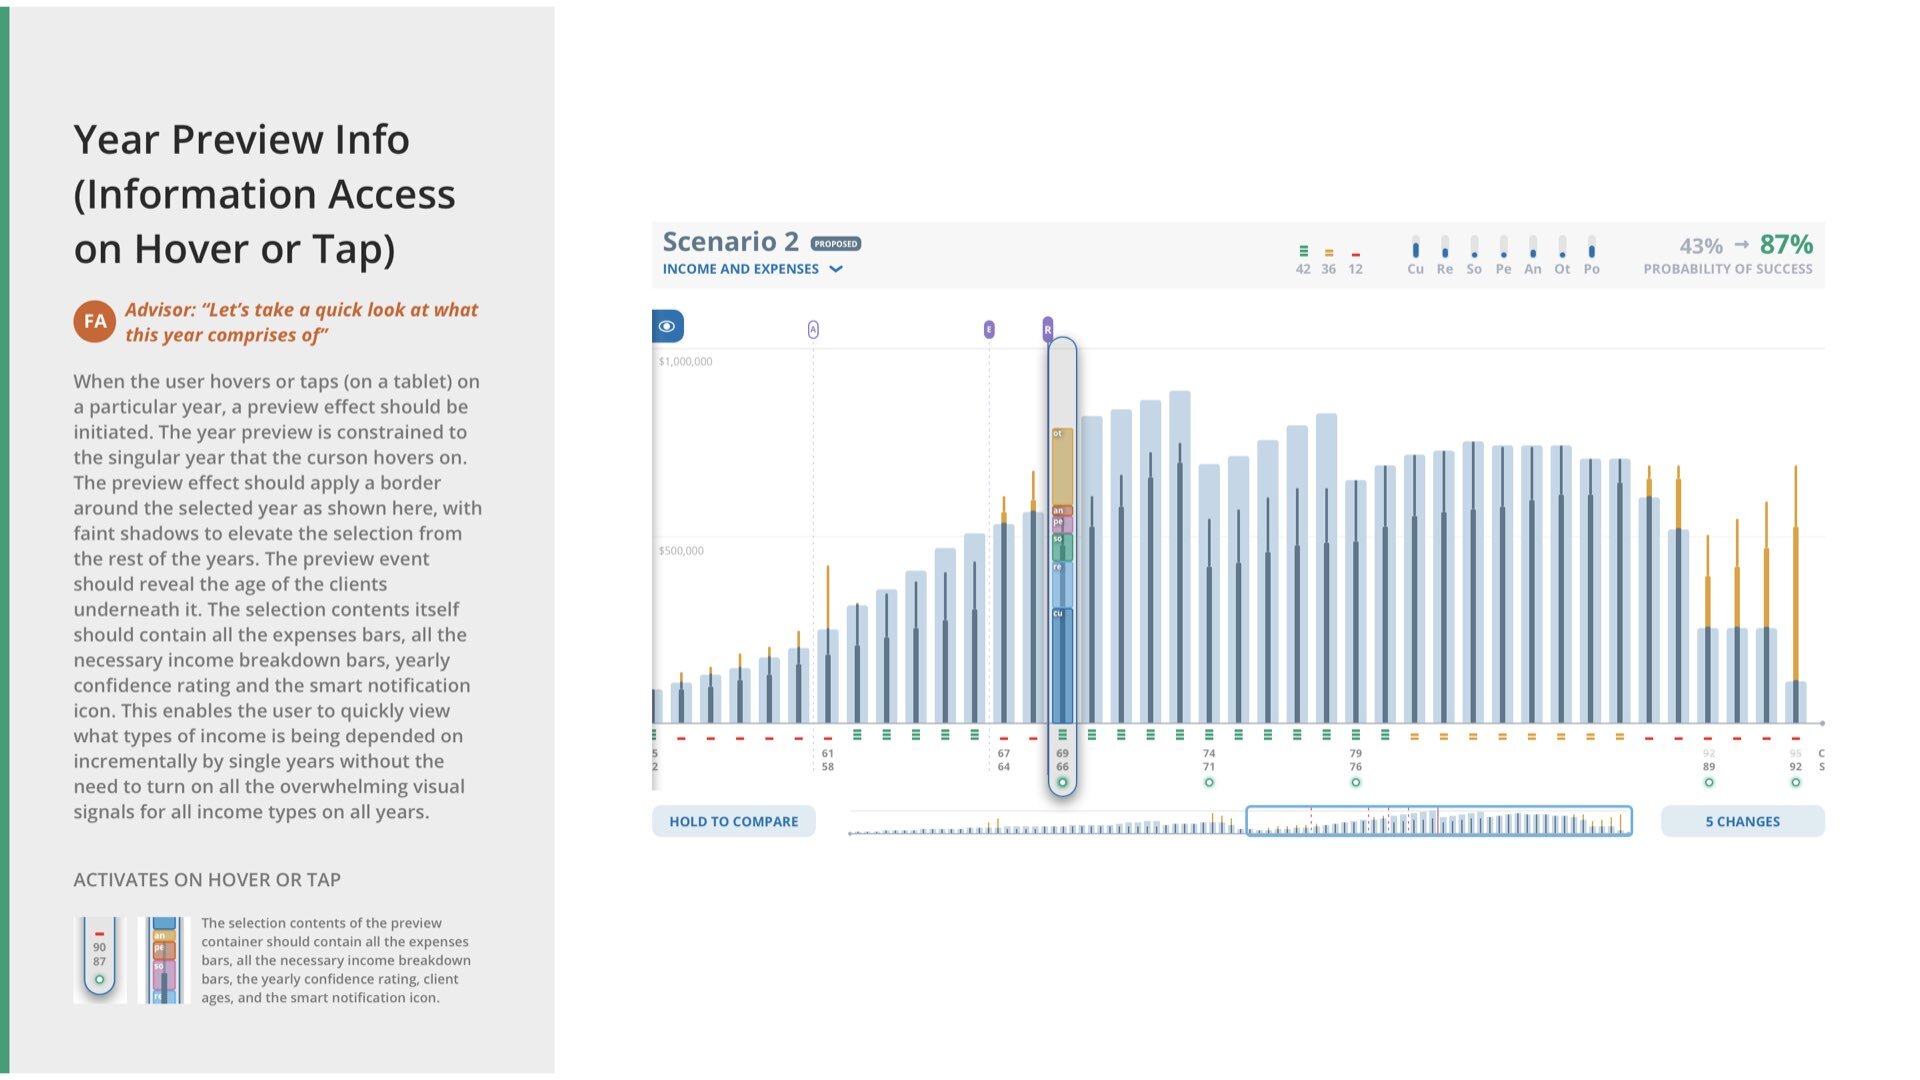
There was also a need to see the entire lifetime of their client at once, but each year (each vertical bar) carried so much information that it was difficult to narrow it down to fit everything, so we designed a way to see the essential parts of the entire year in a smaller minimap where you can scrub left to right to view a section of interest.
HAPPY CUSTOMER, NEW S.O.W.
After this engagement, the client saw the value of design thinking in helping them find solutions to their problems and continued to have new projects with me. The next project was all about creating a powerful visualization tool tailored for their users.


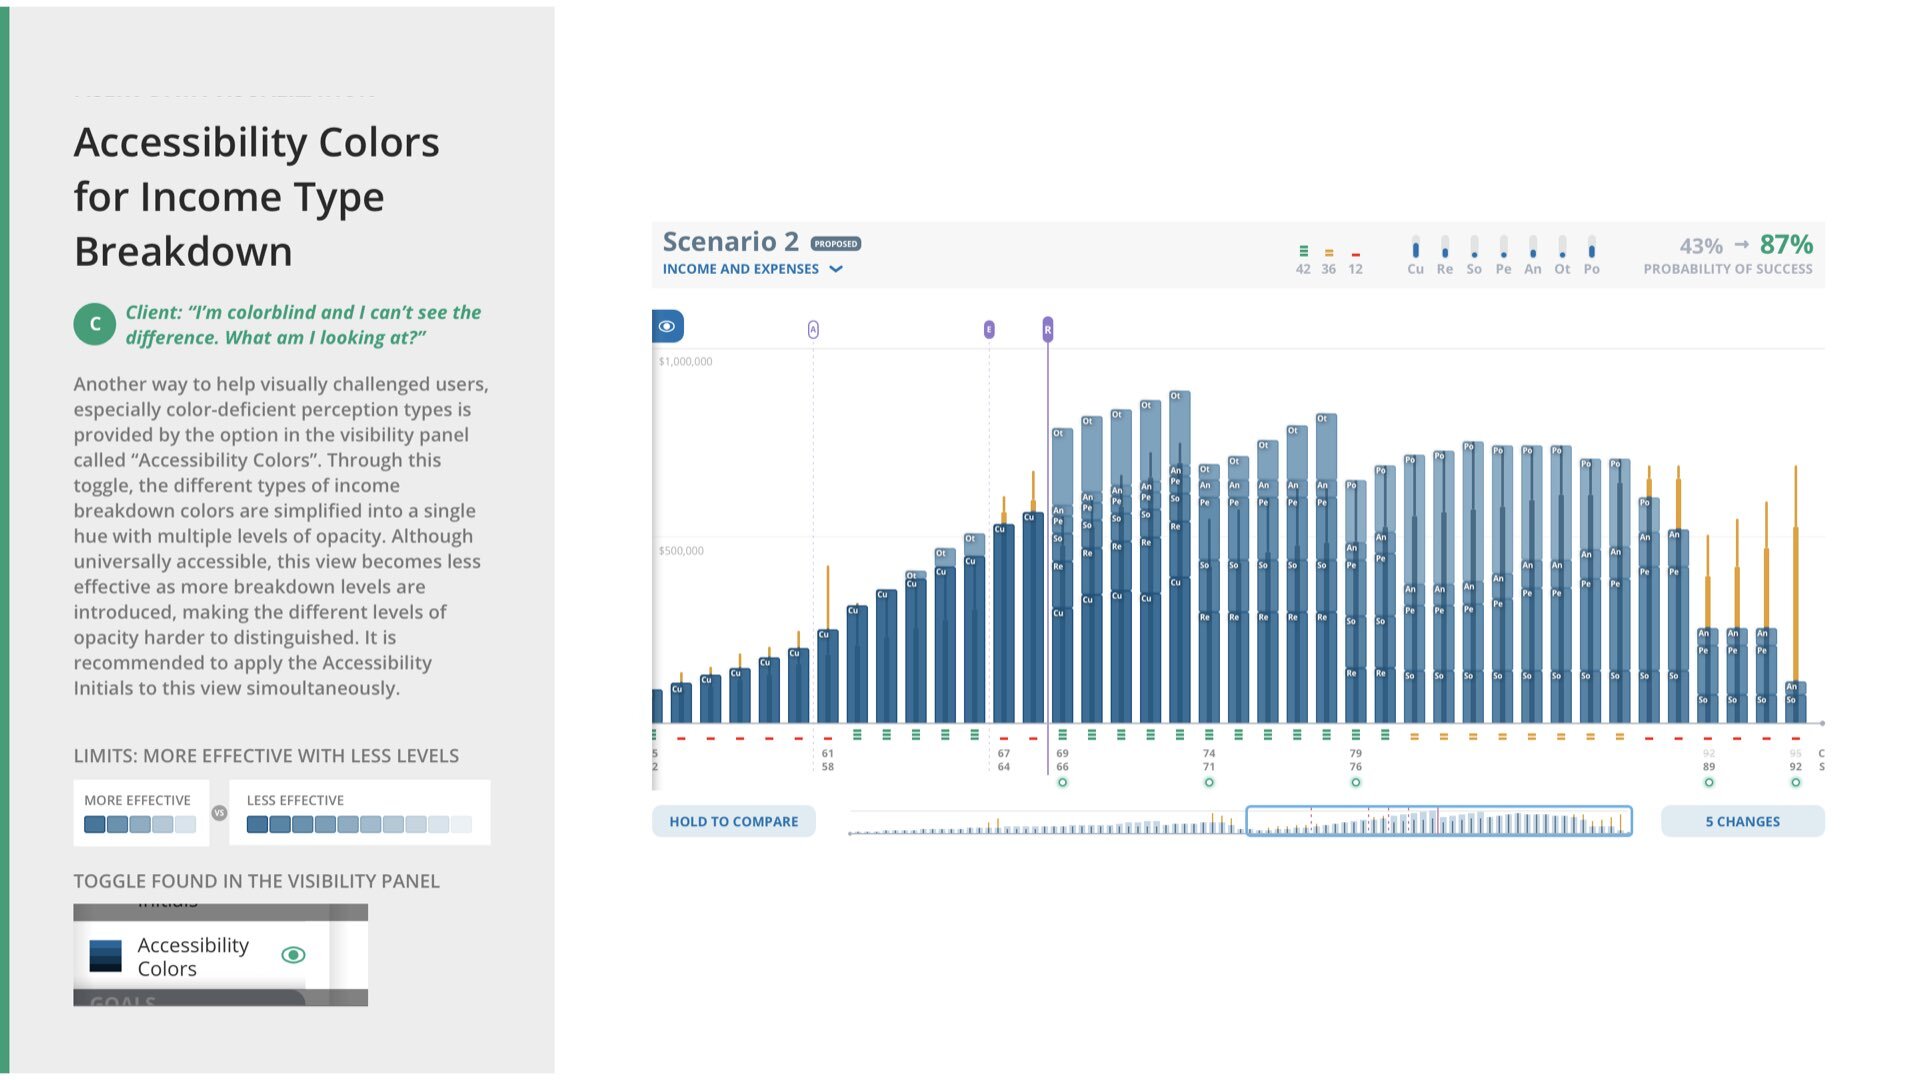
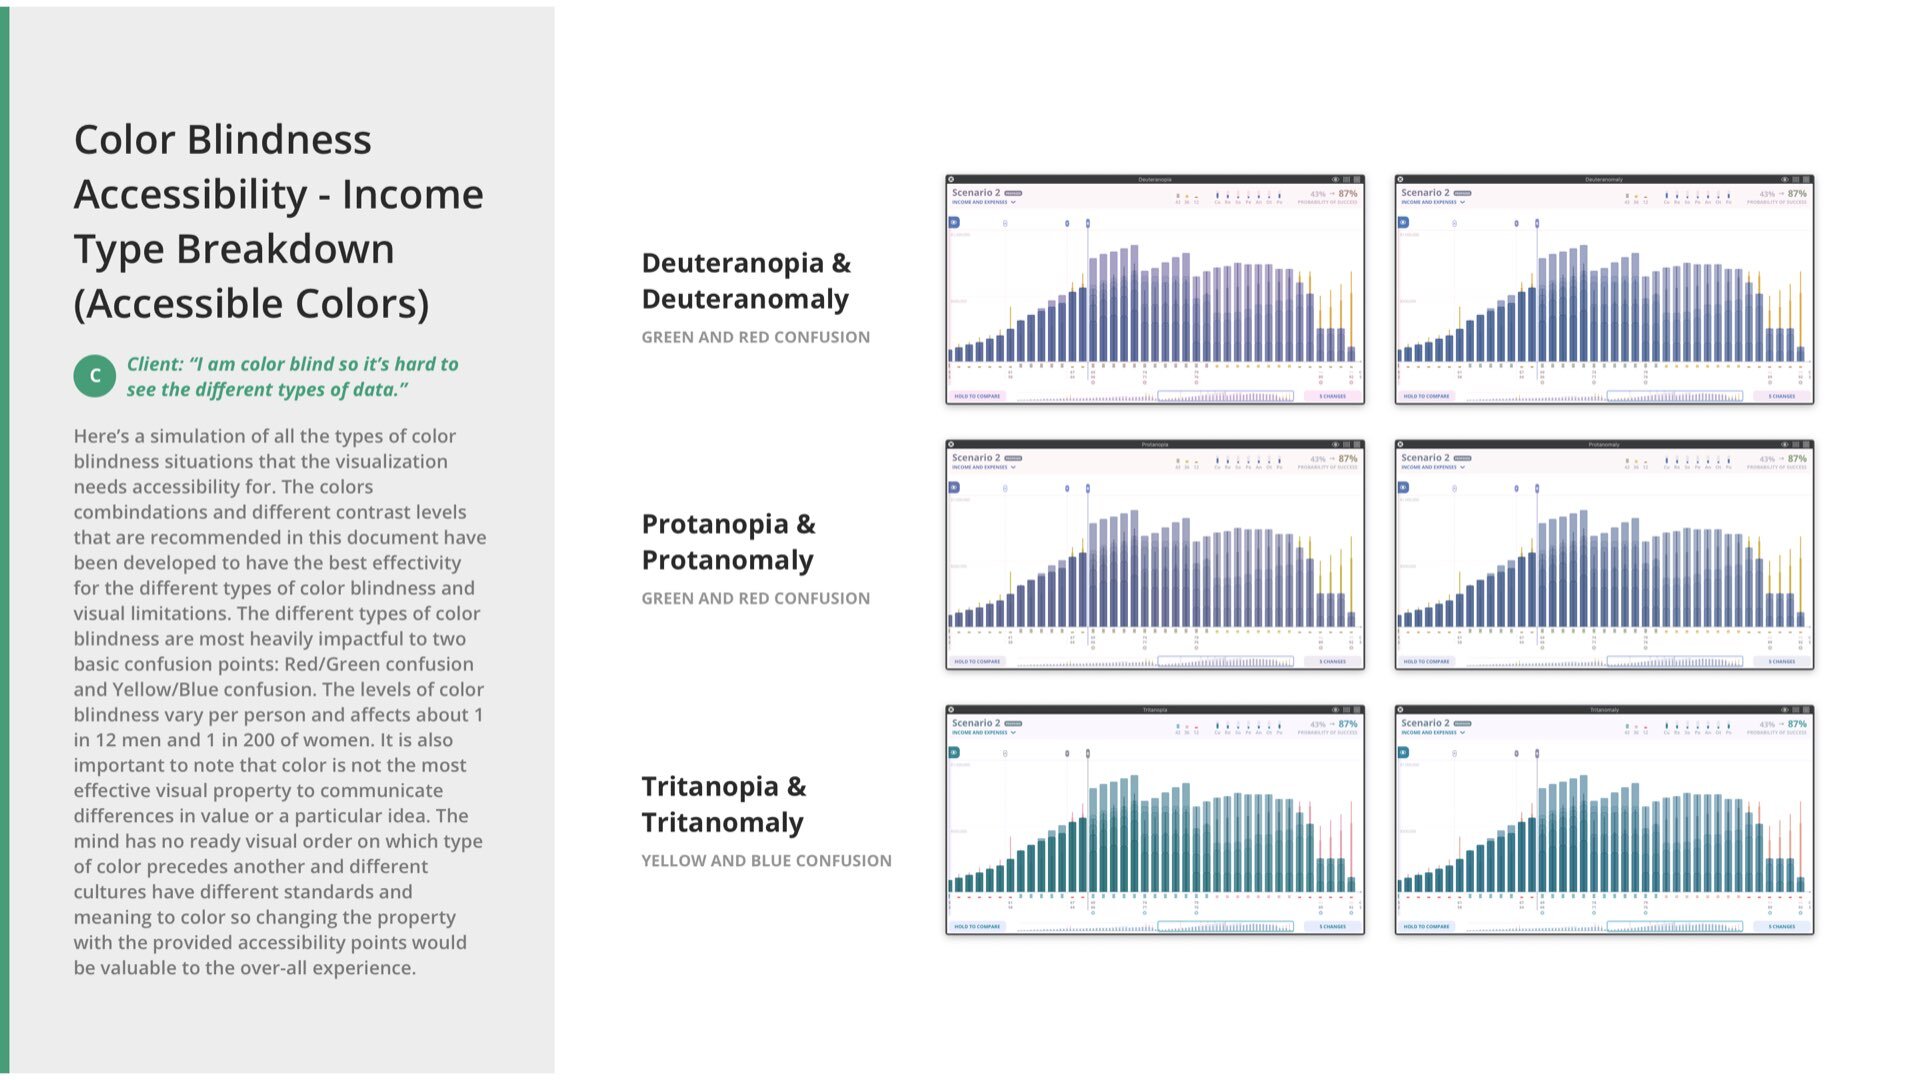
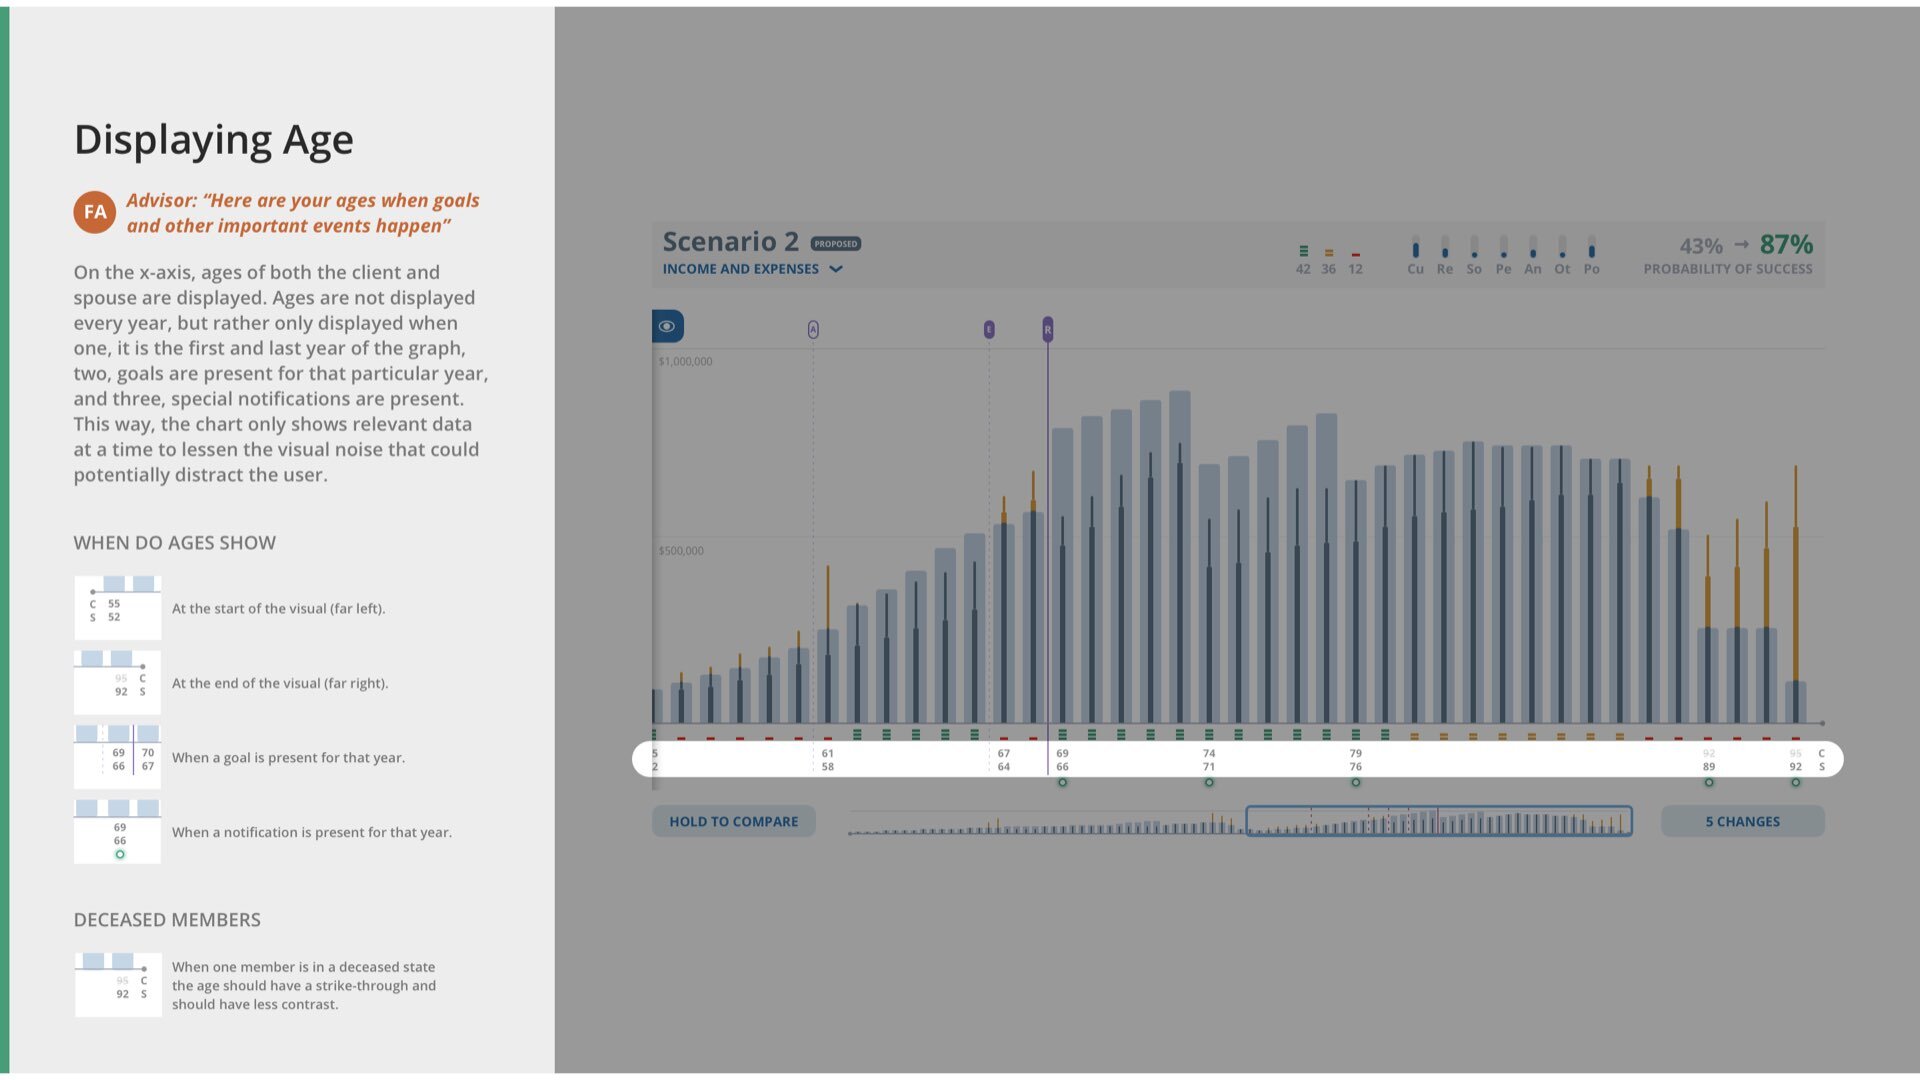
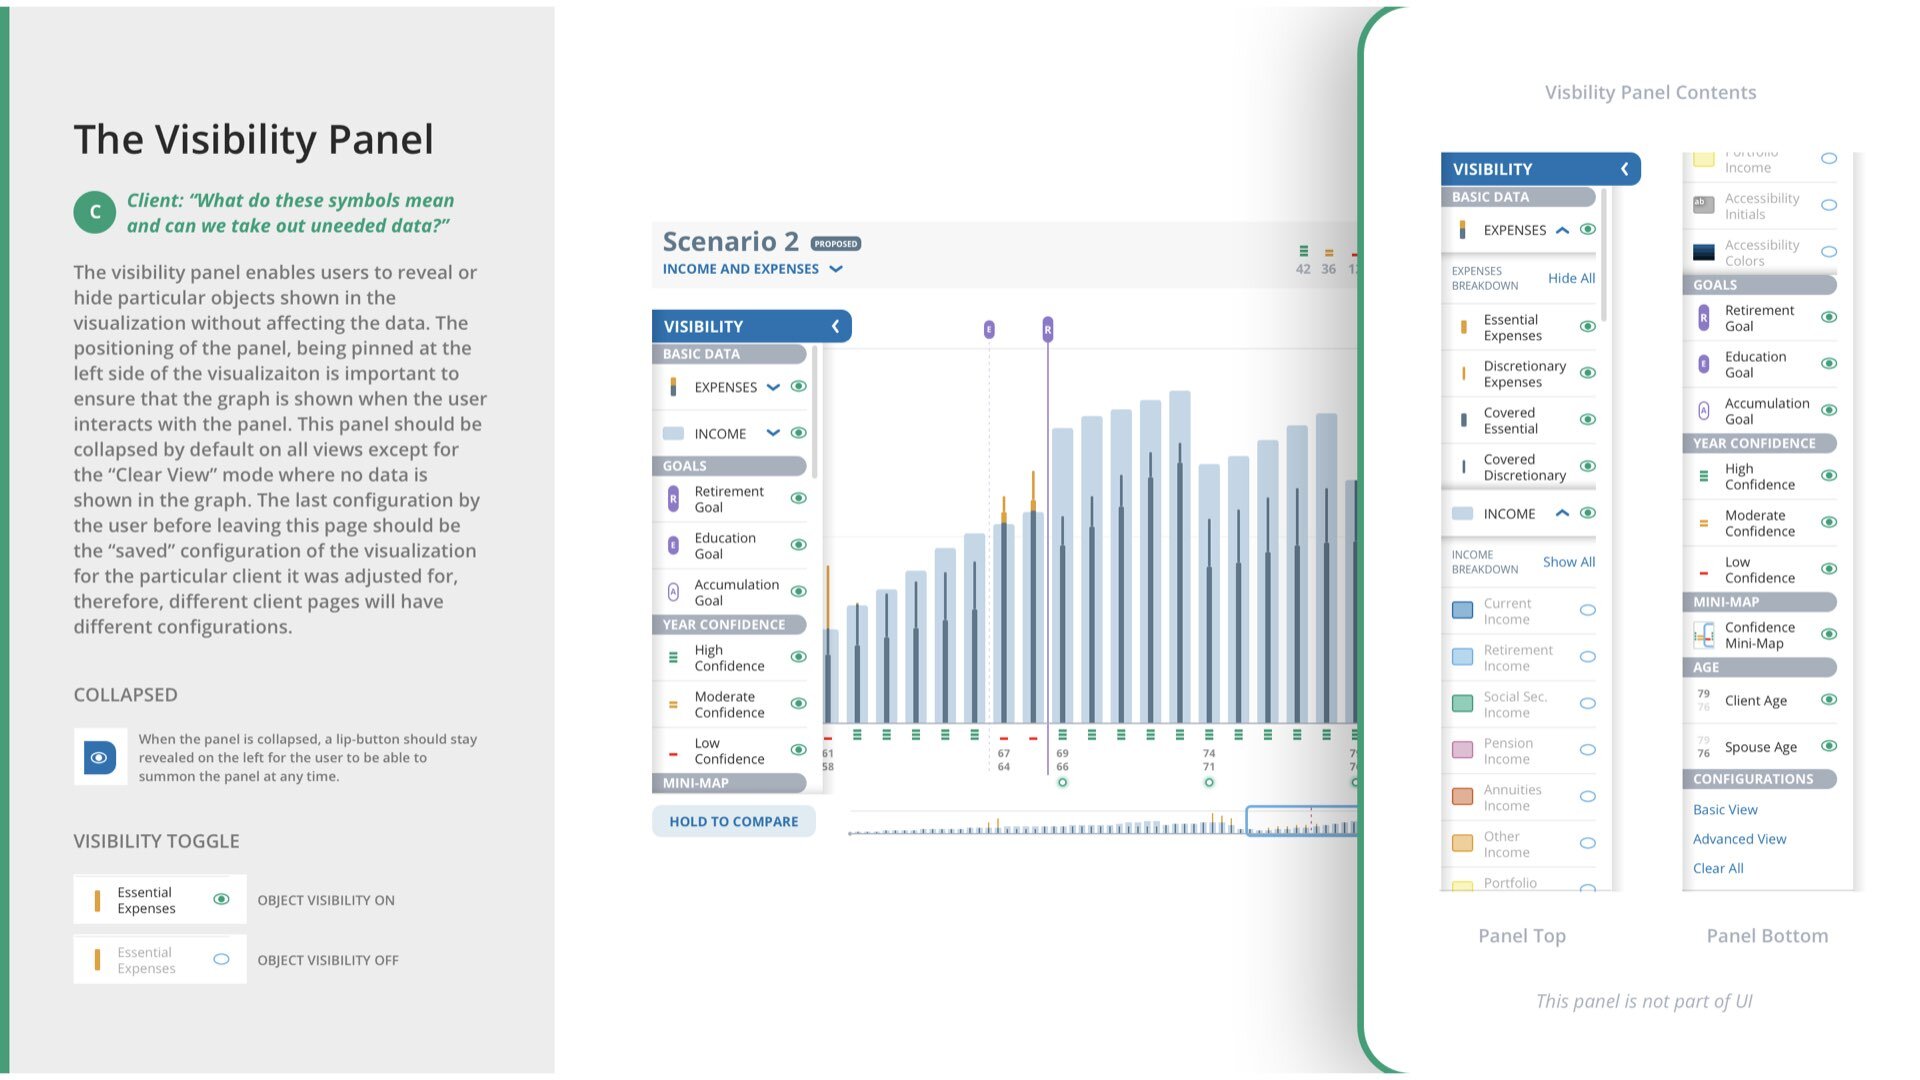
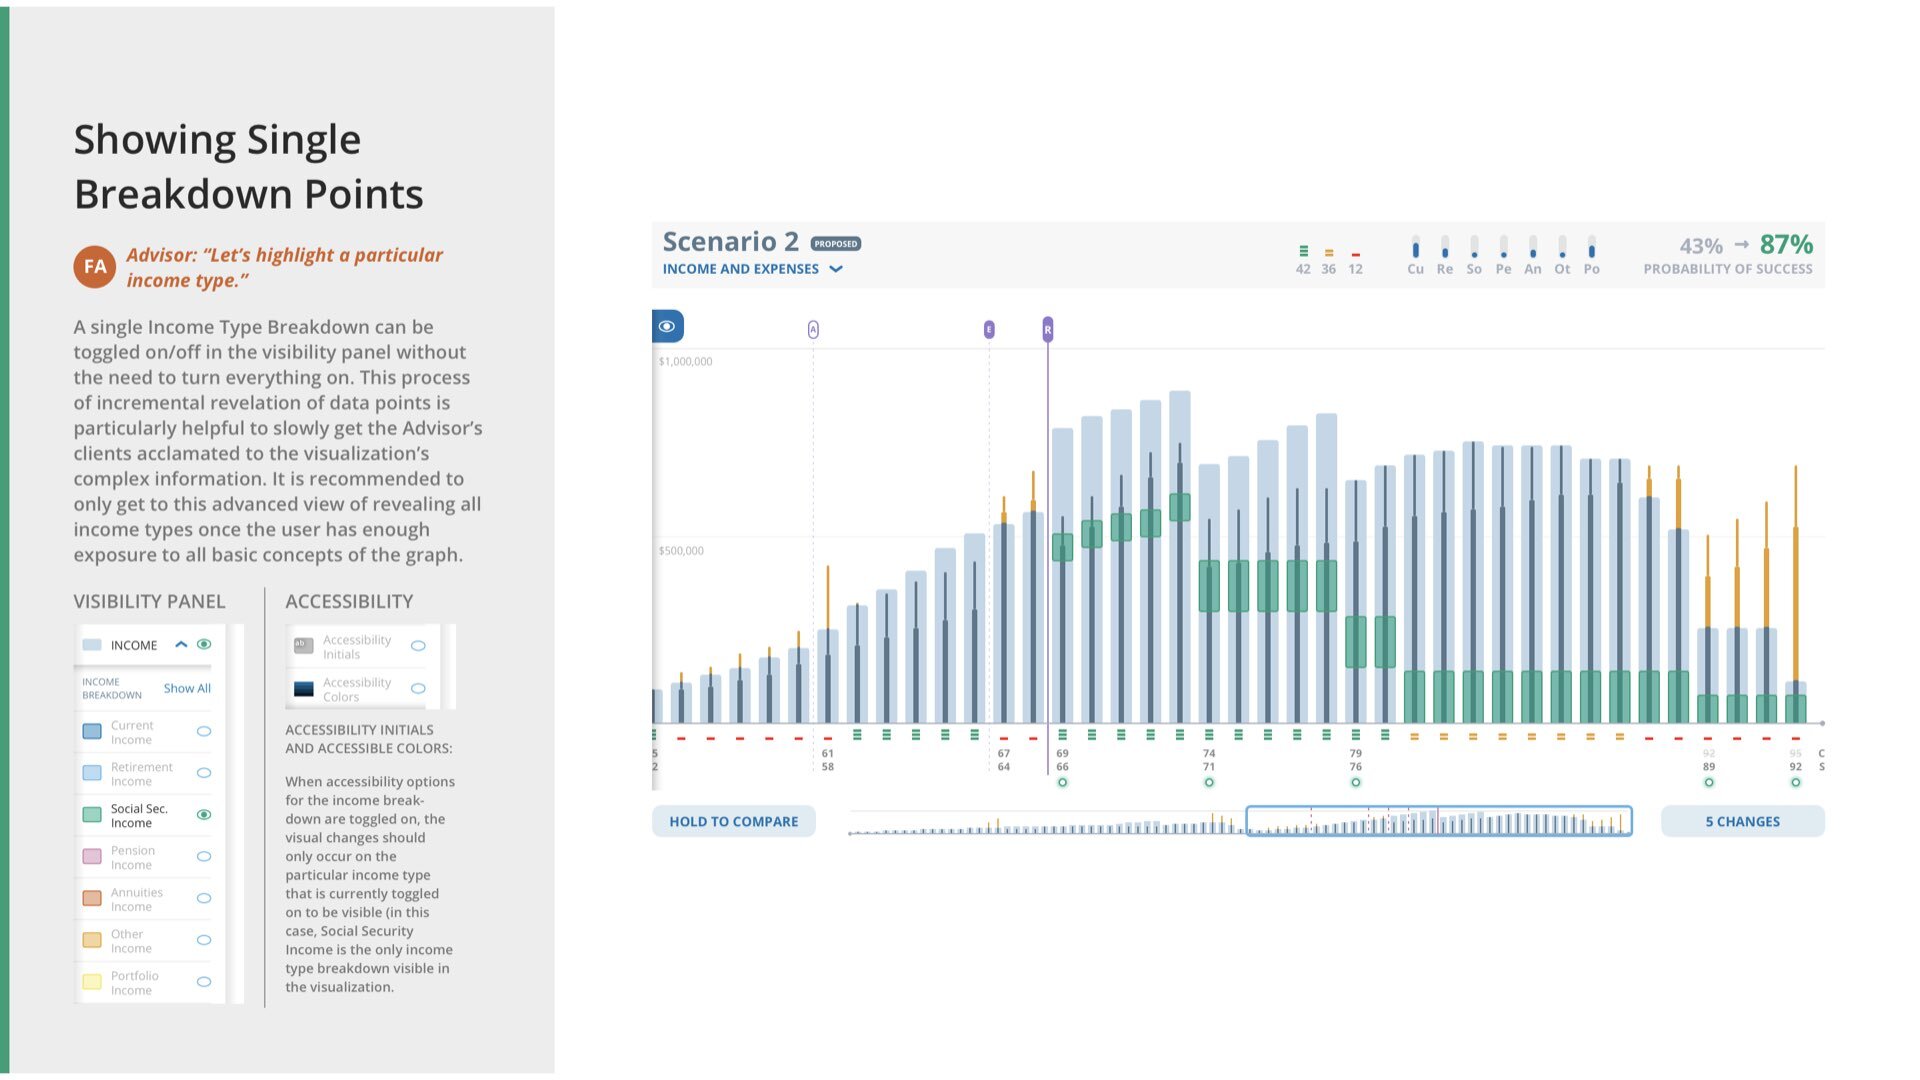
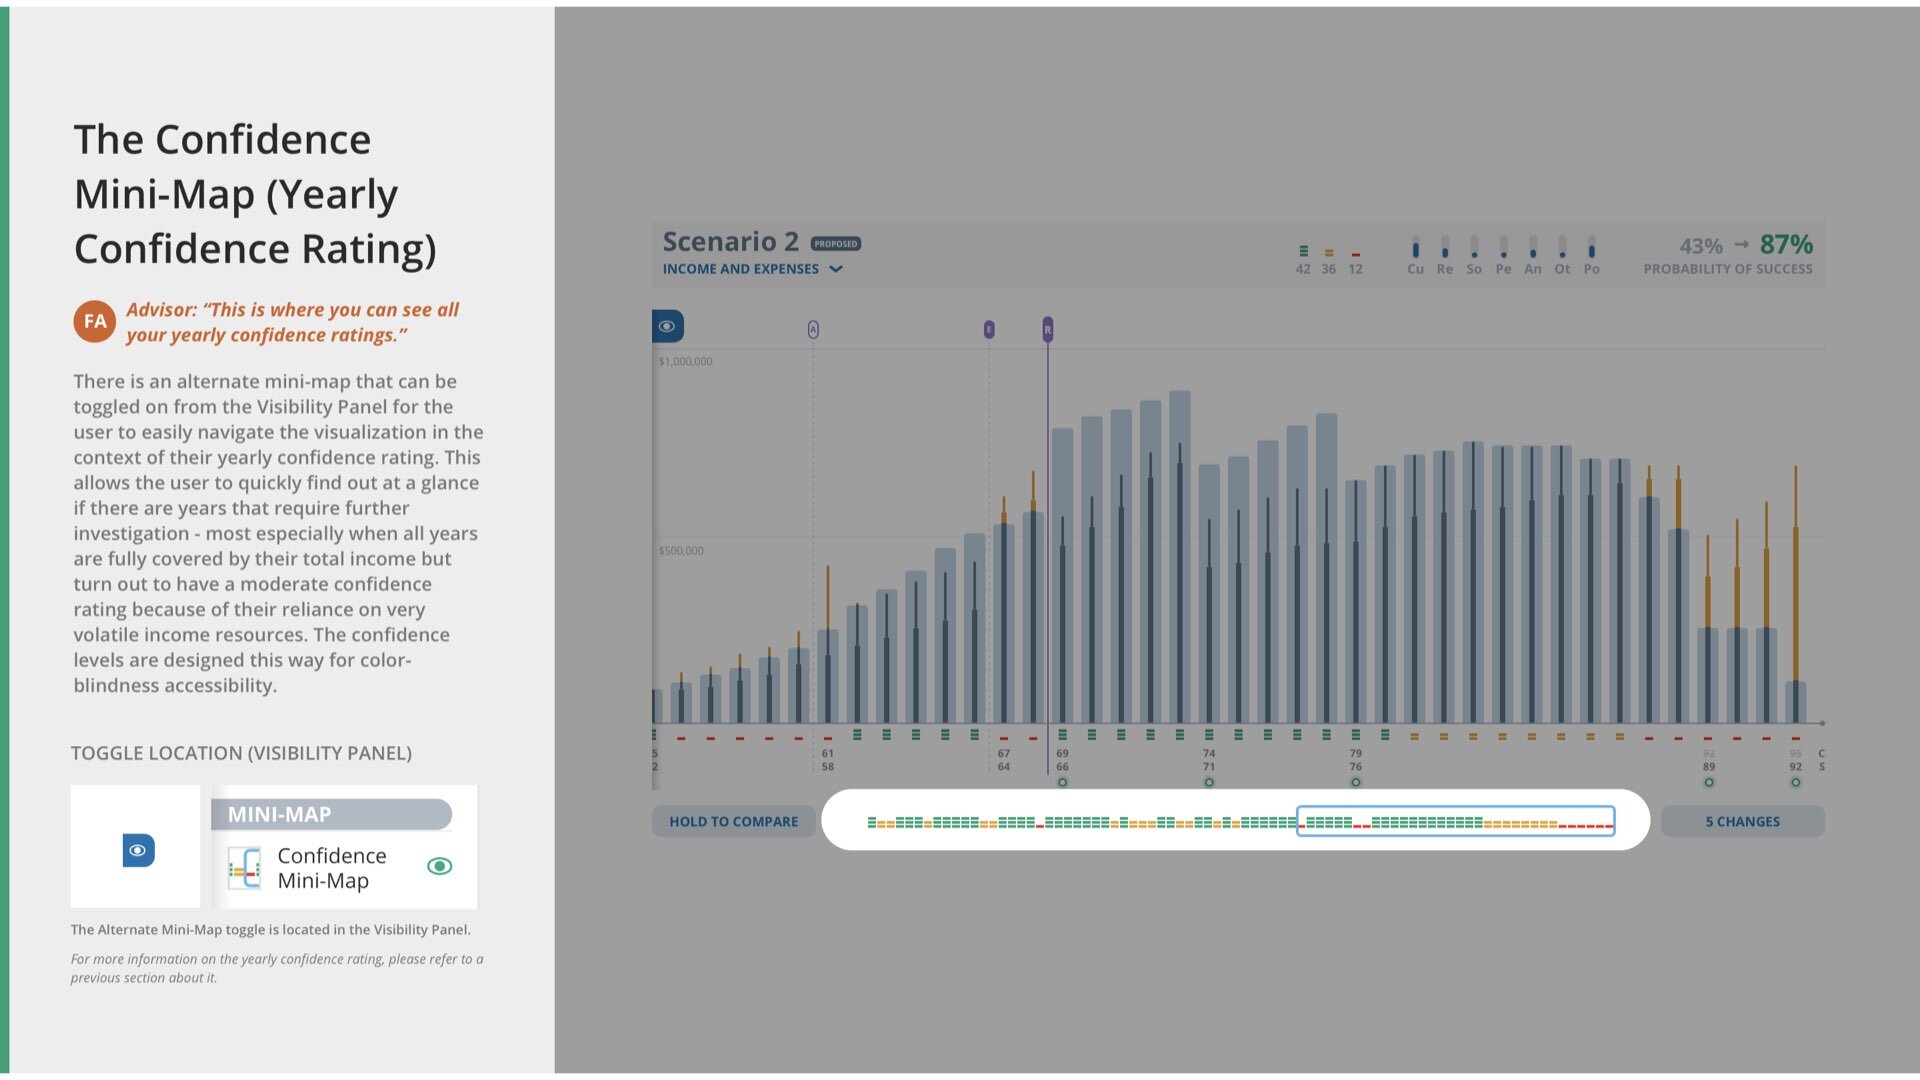
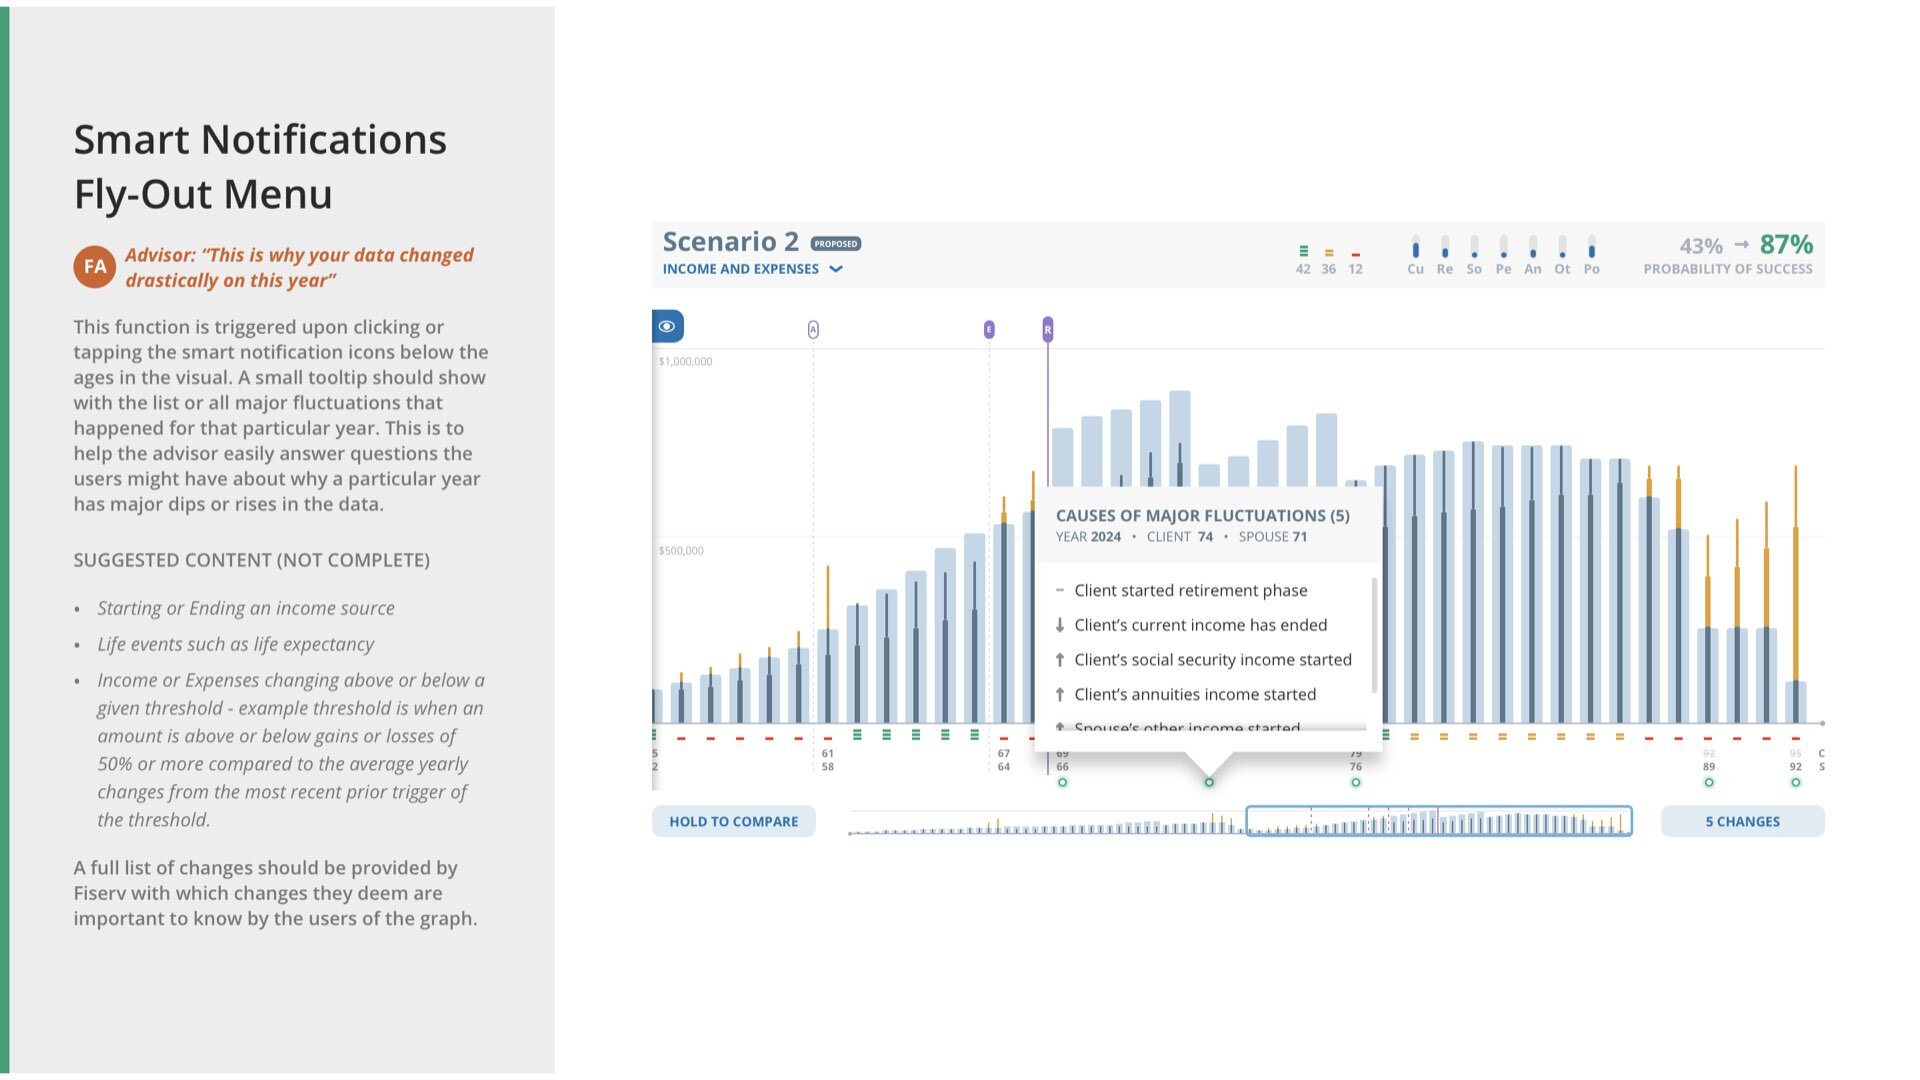
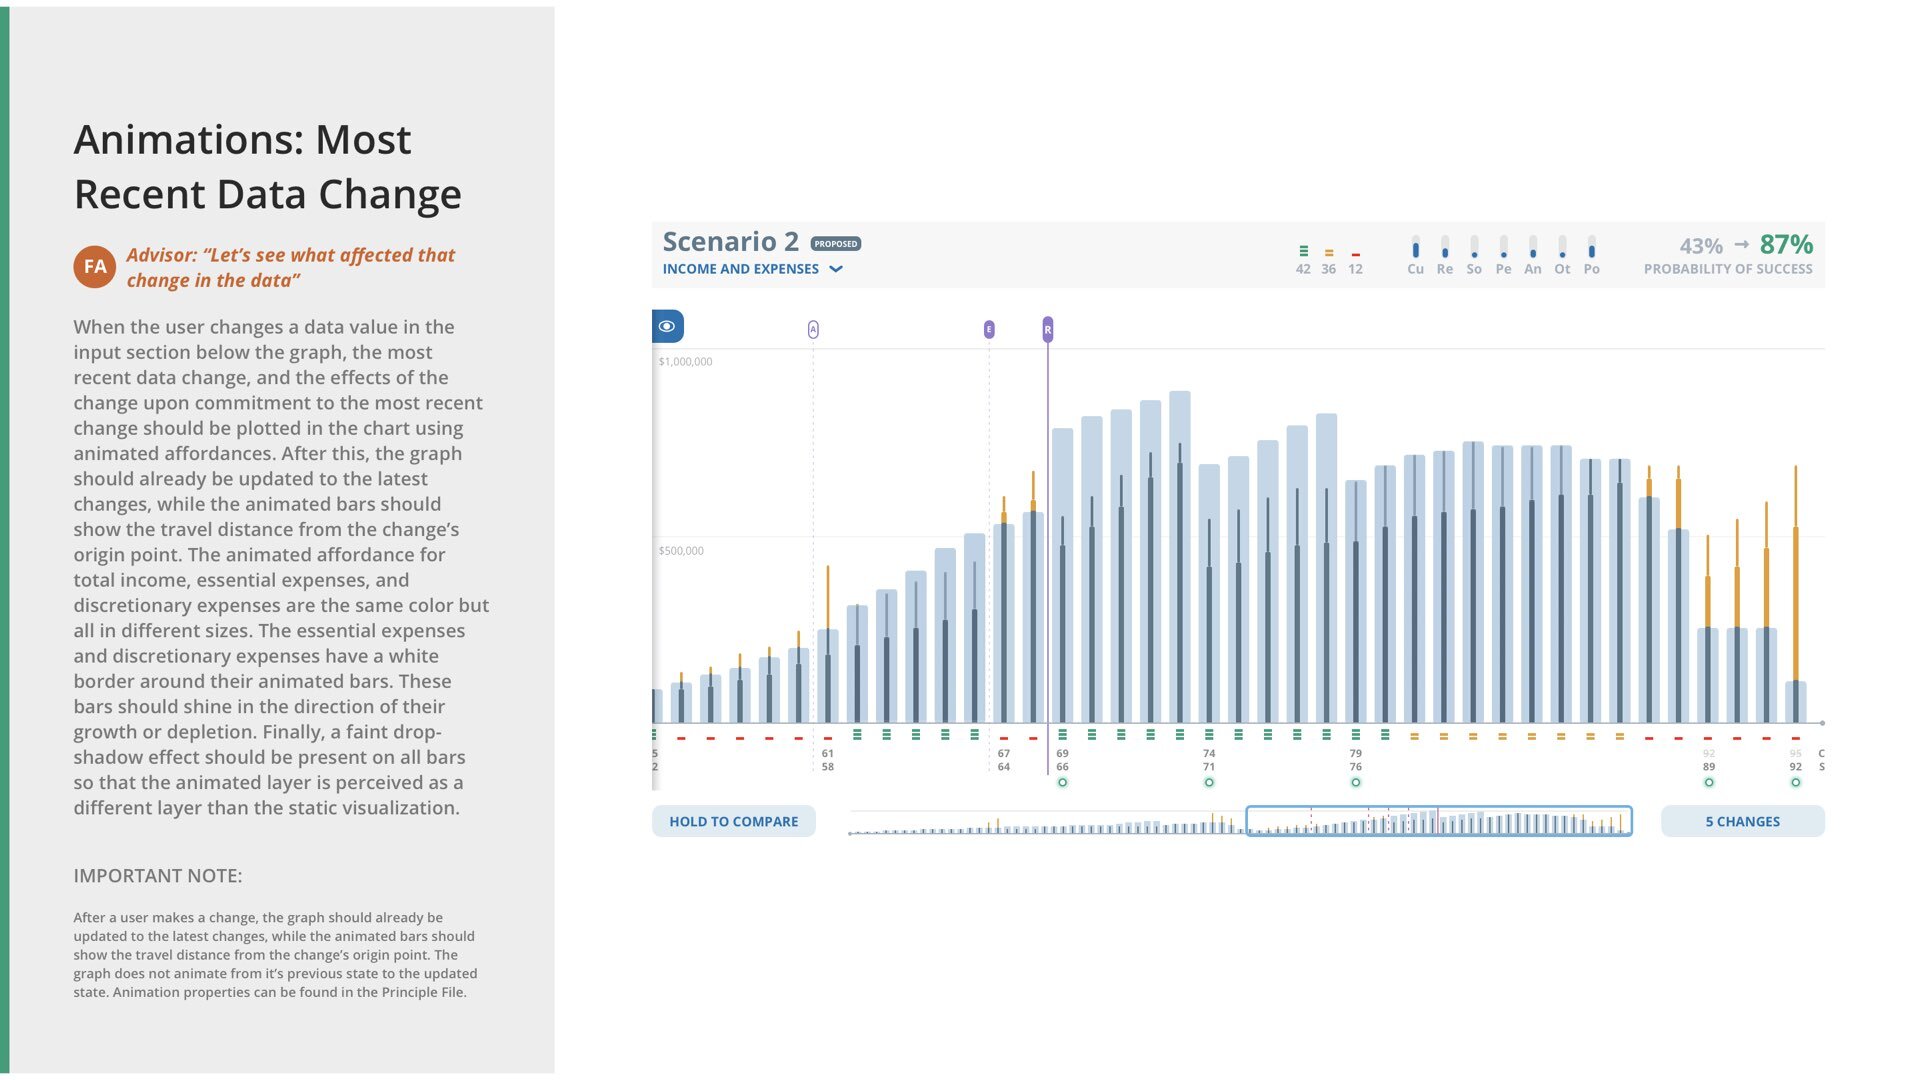
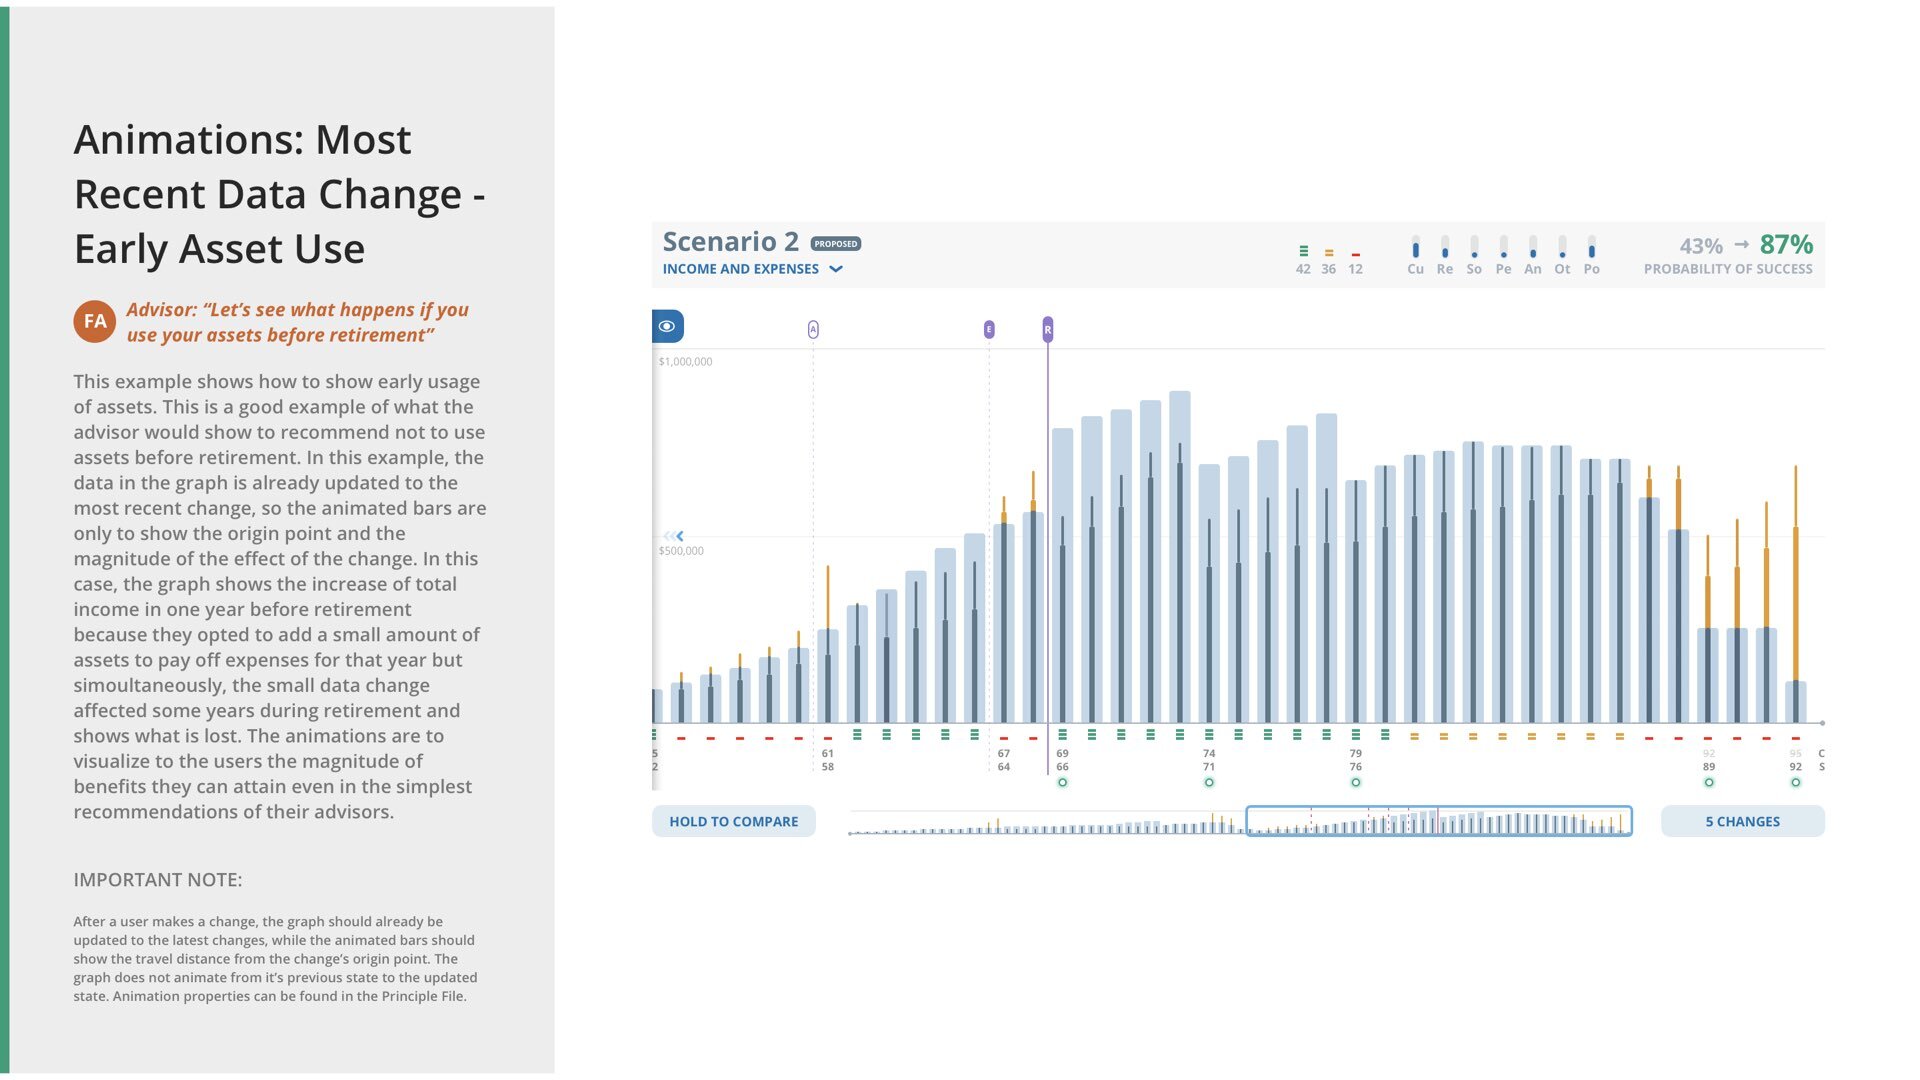
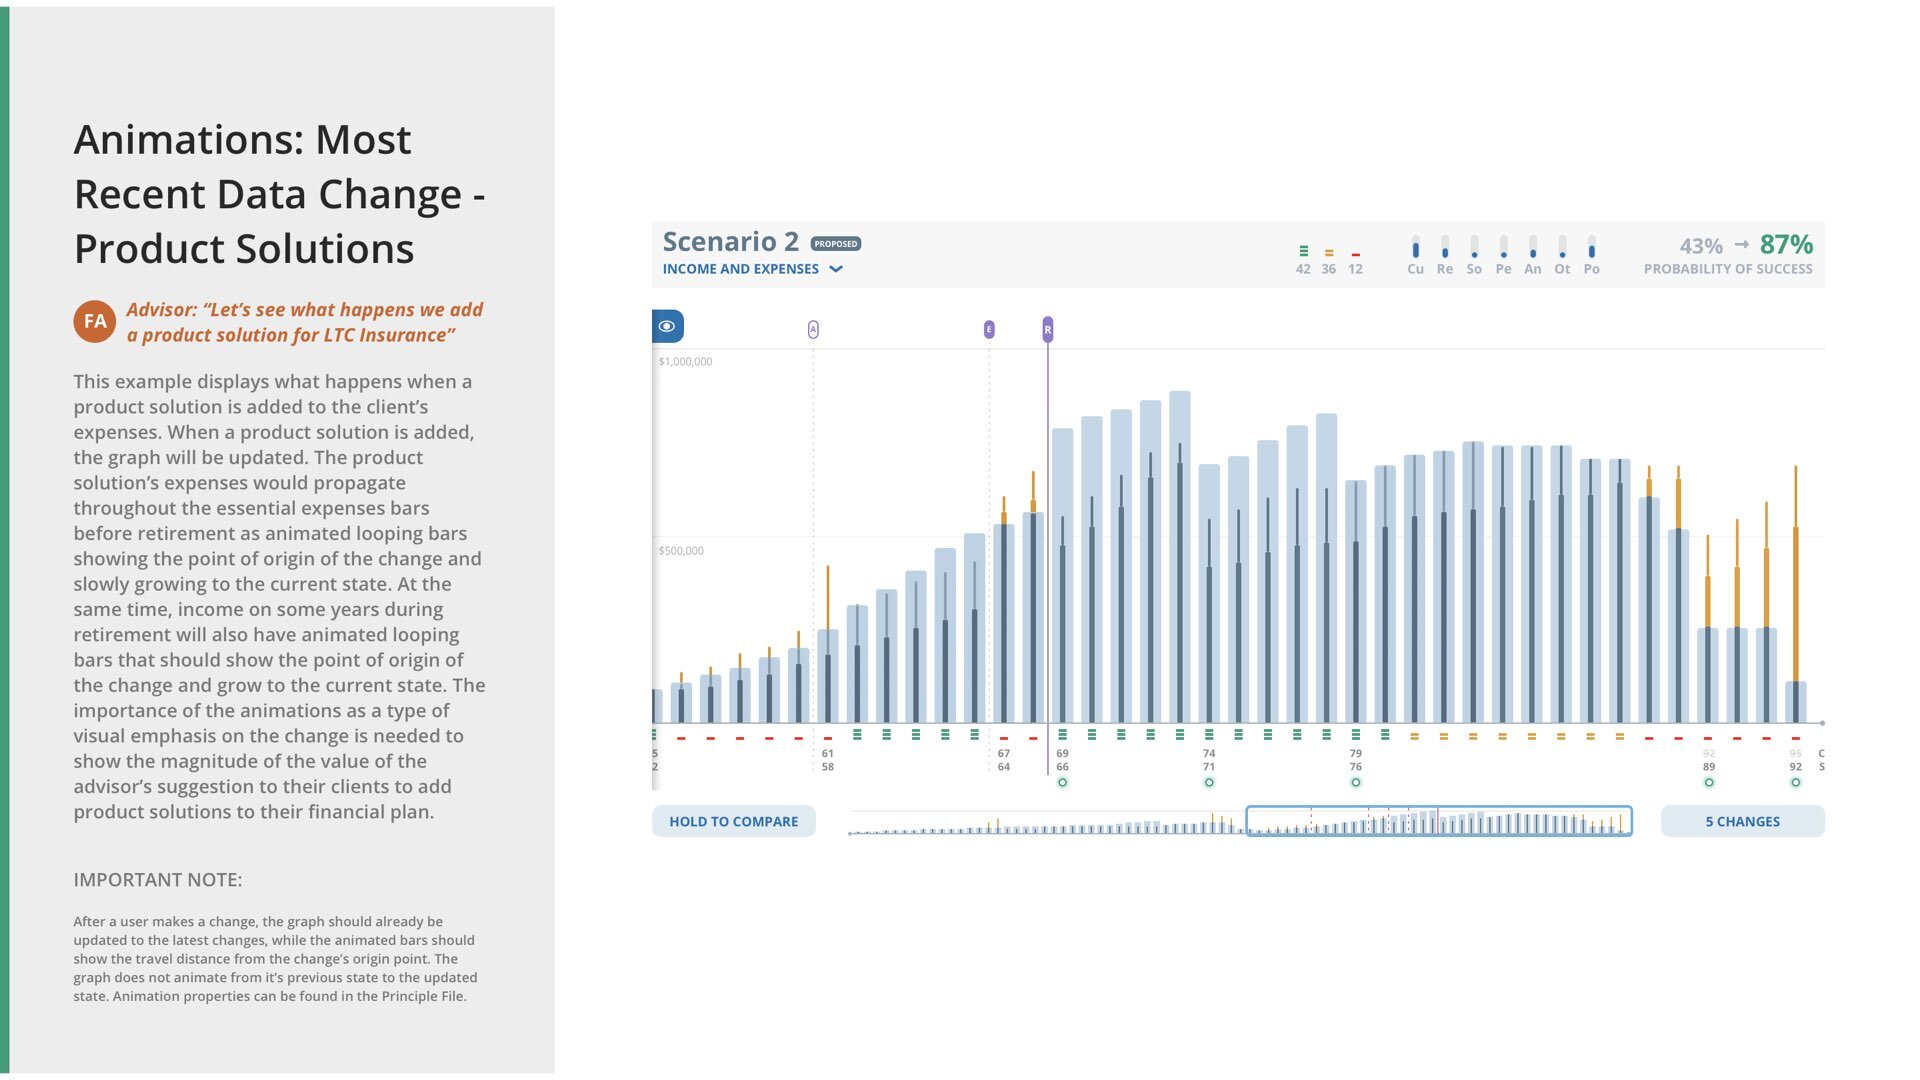
DATA VISUALIZATION GUIDE
I created a visualization interface guide to express the different features the interaction can do.
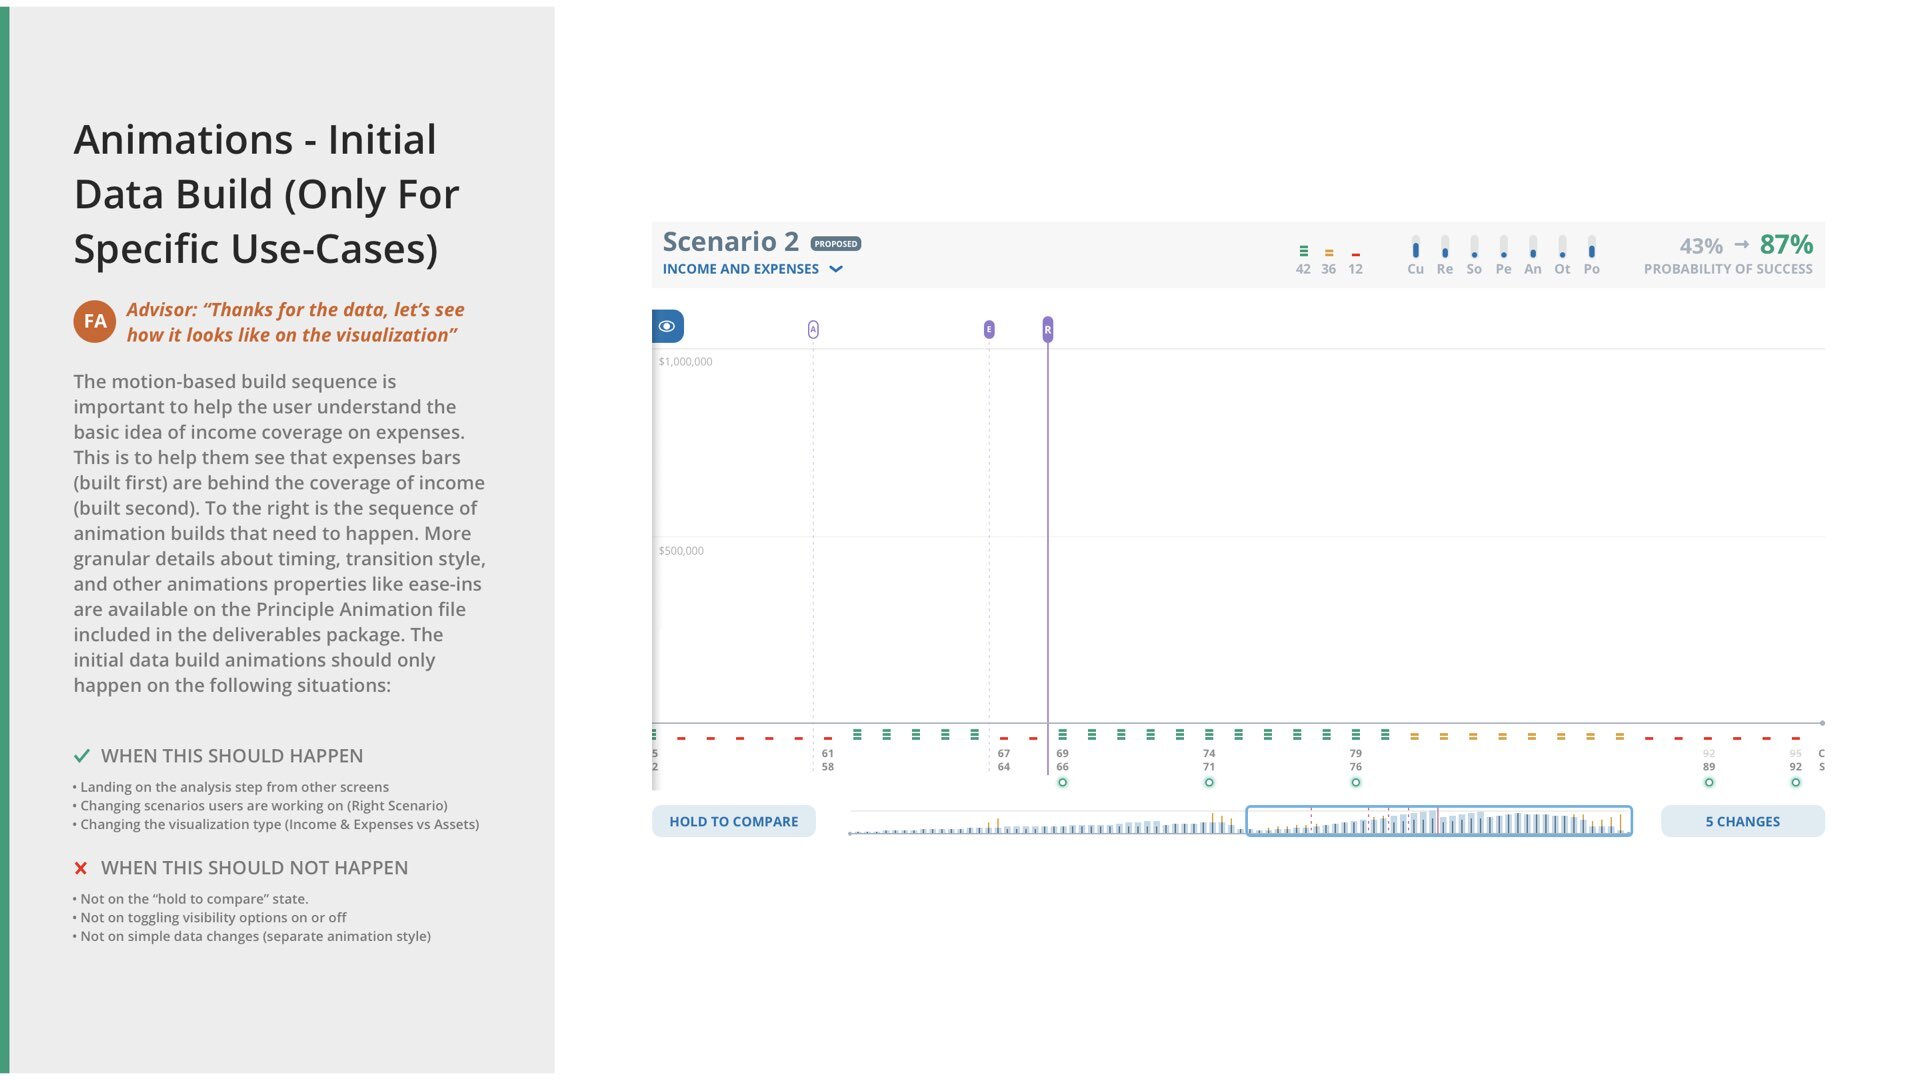
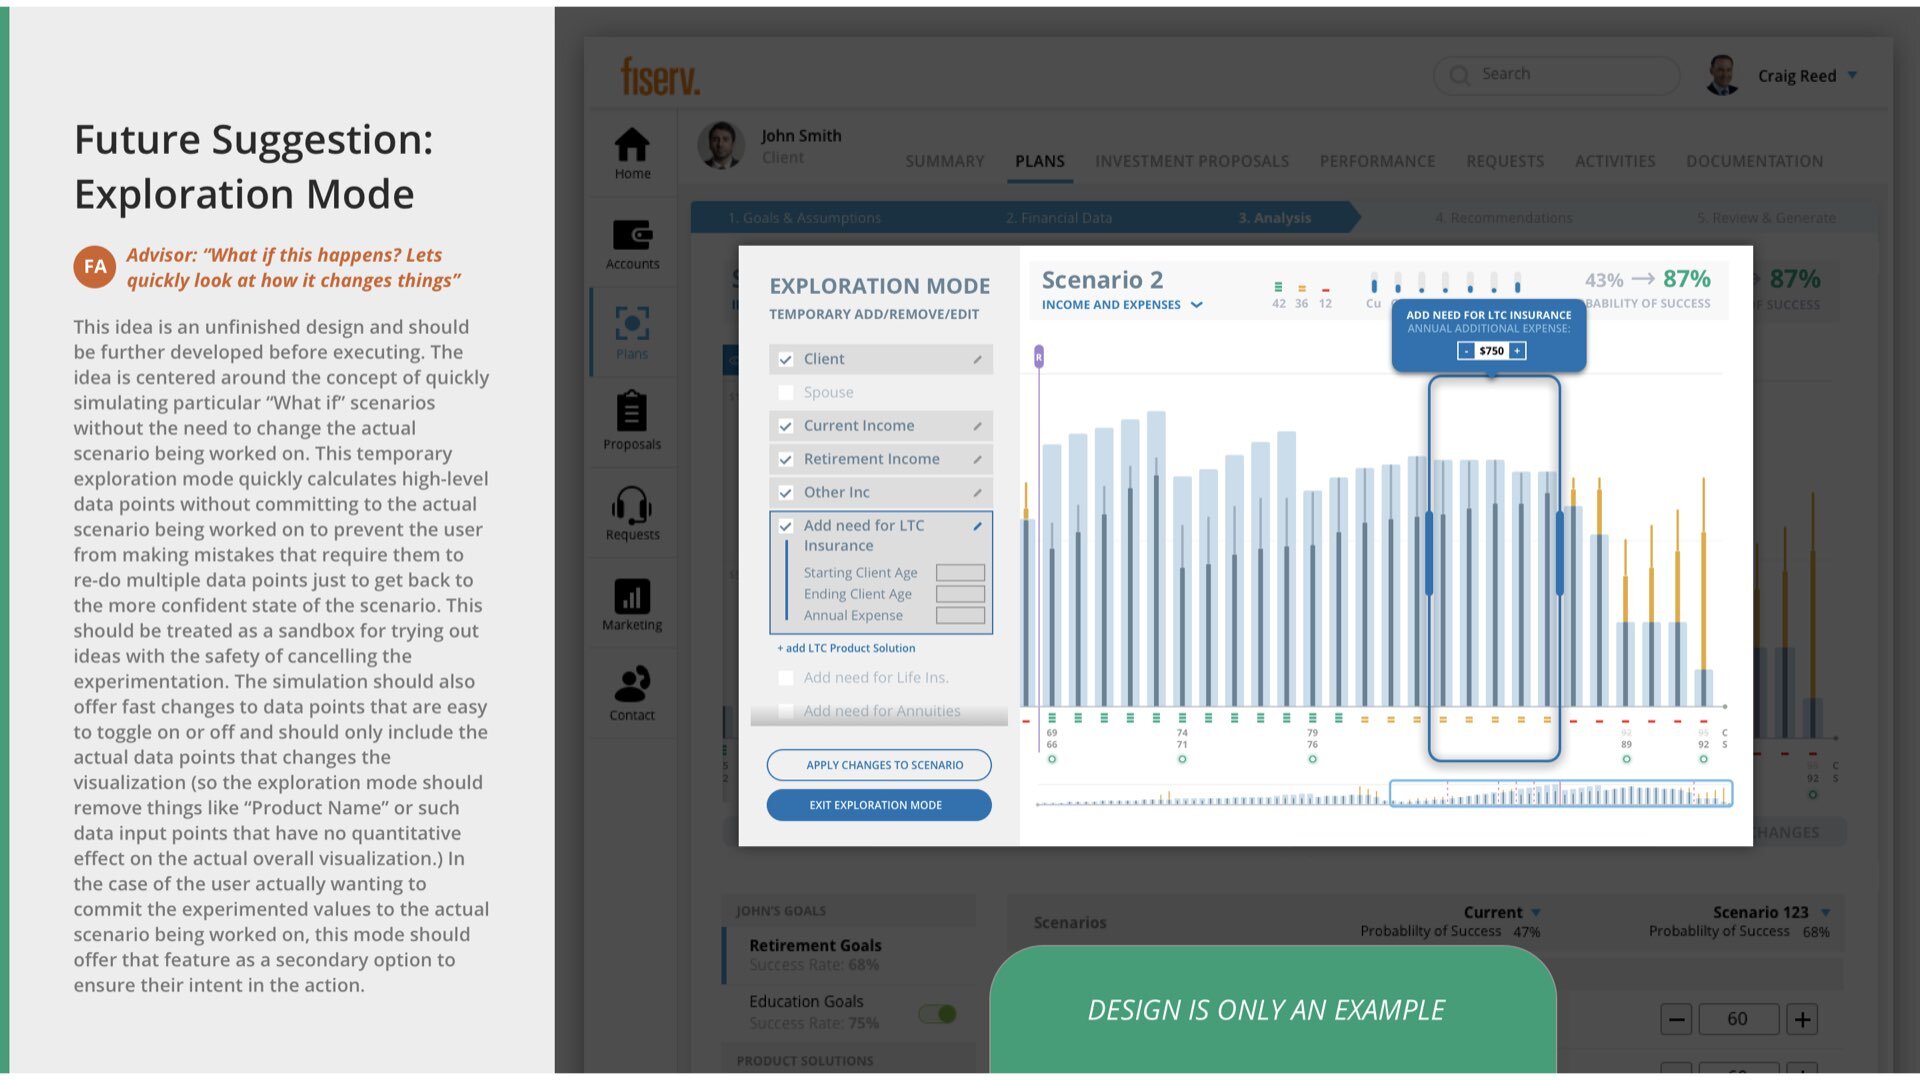
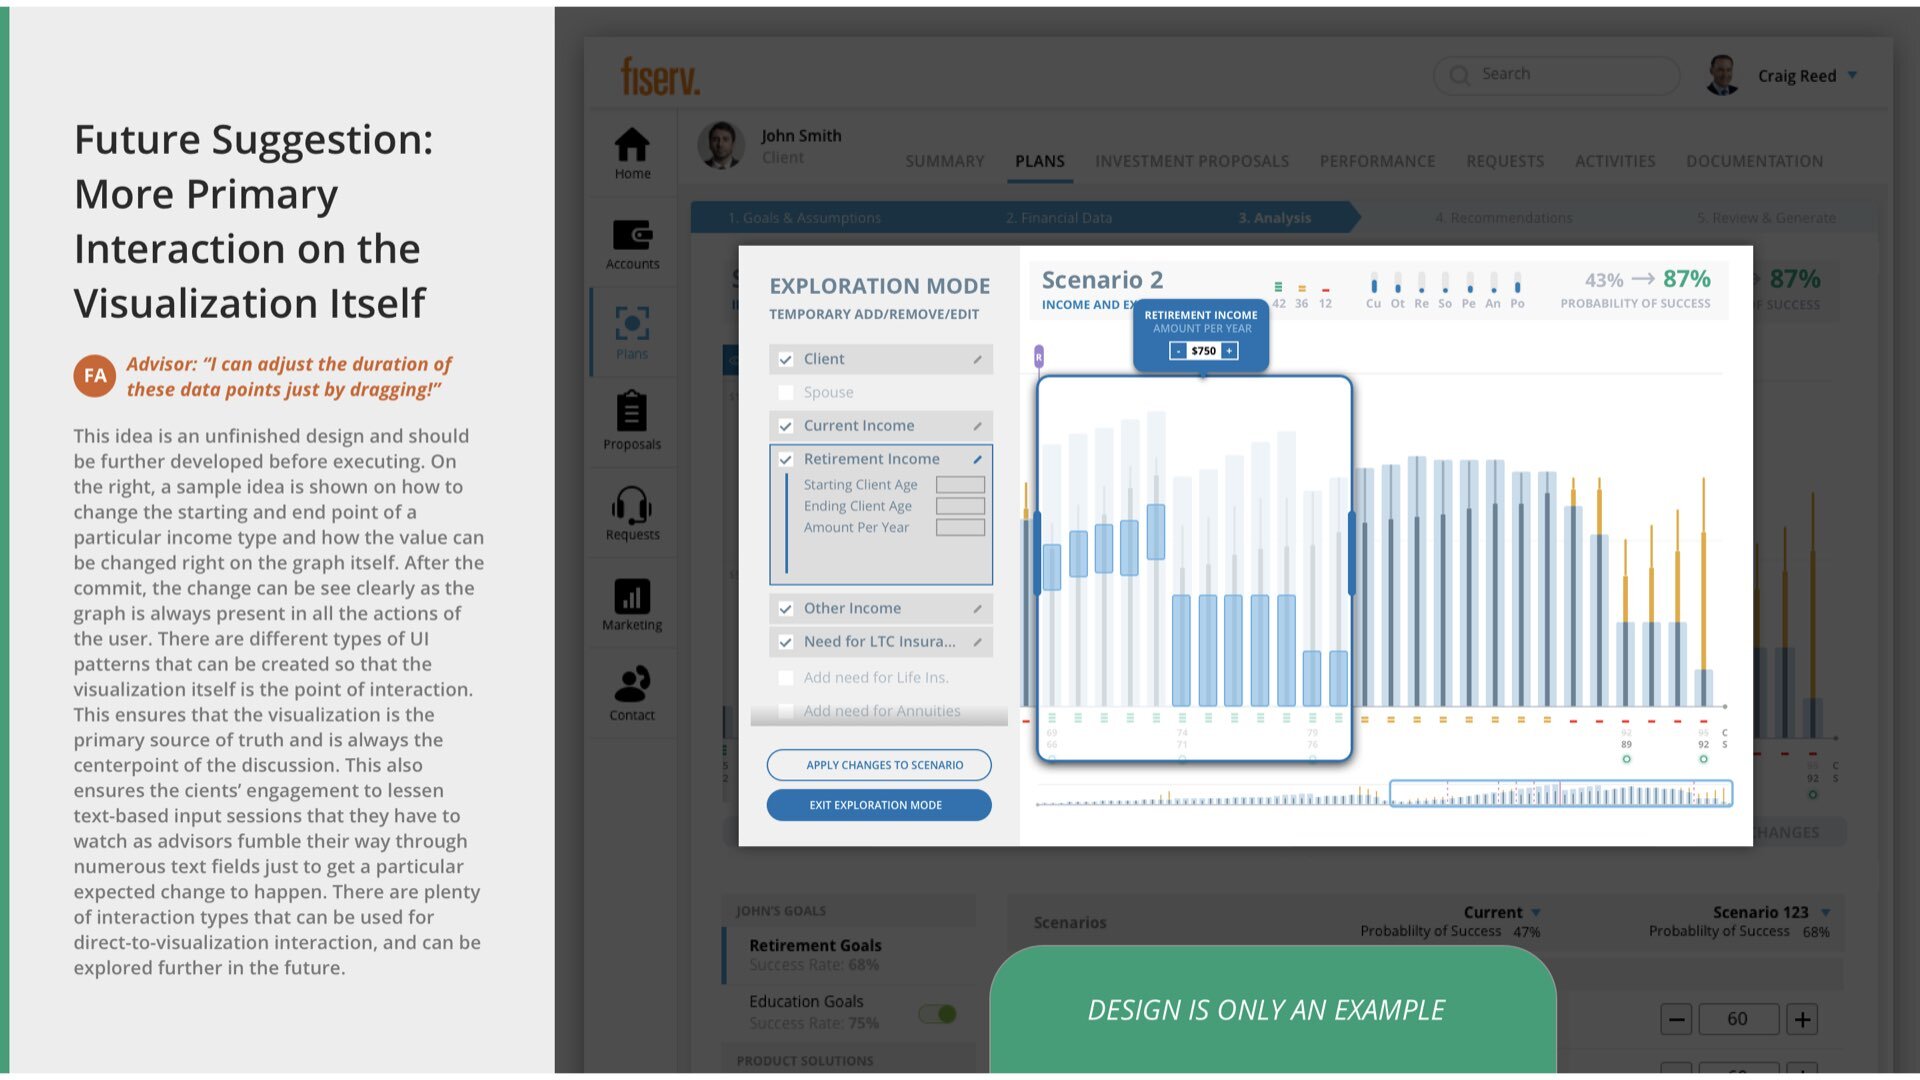
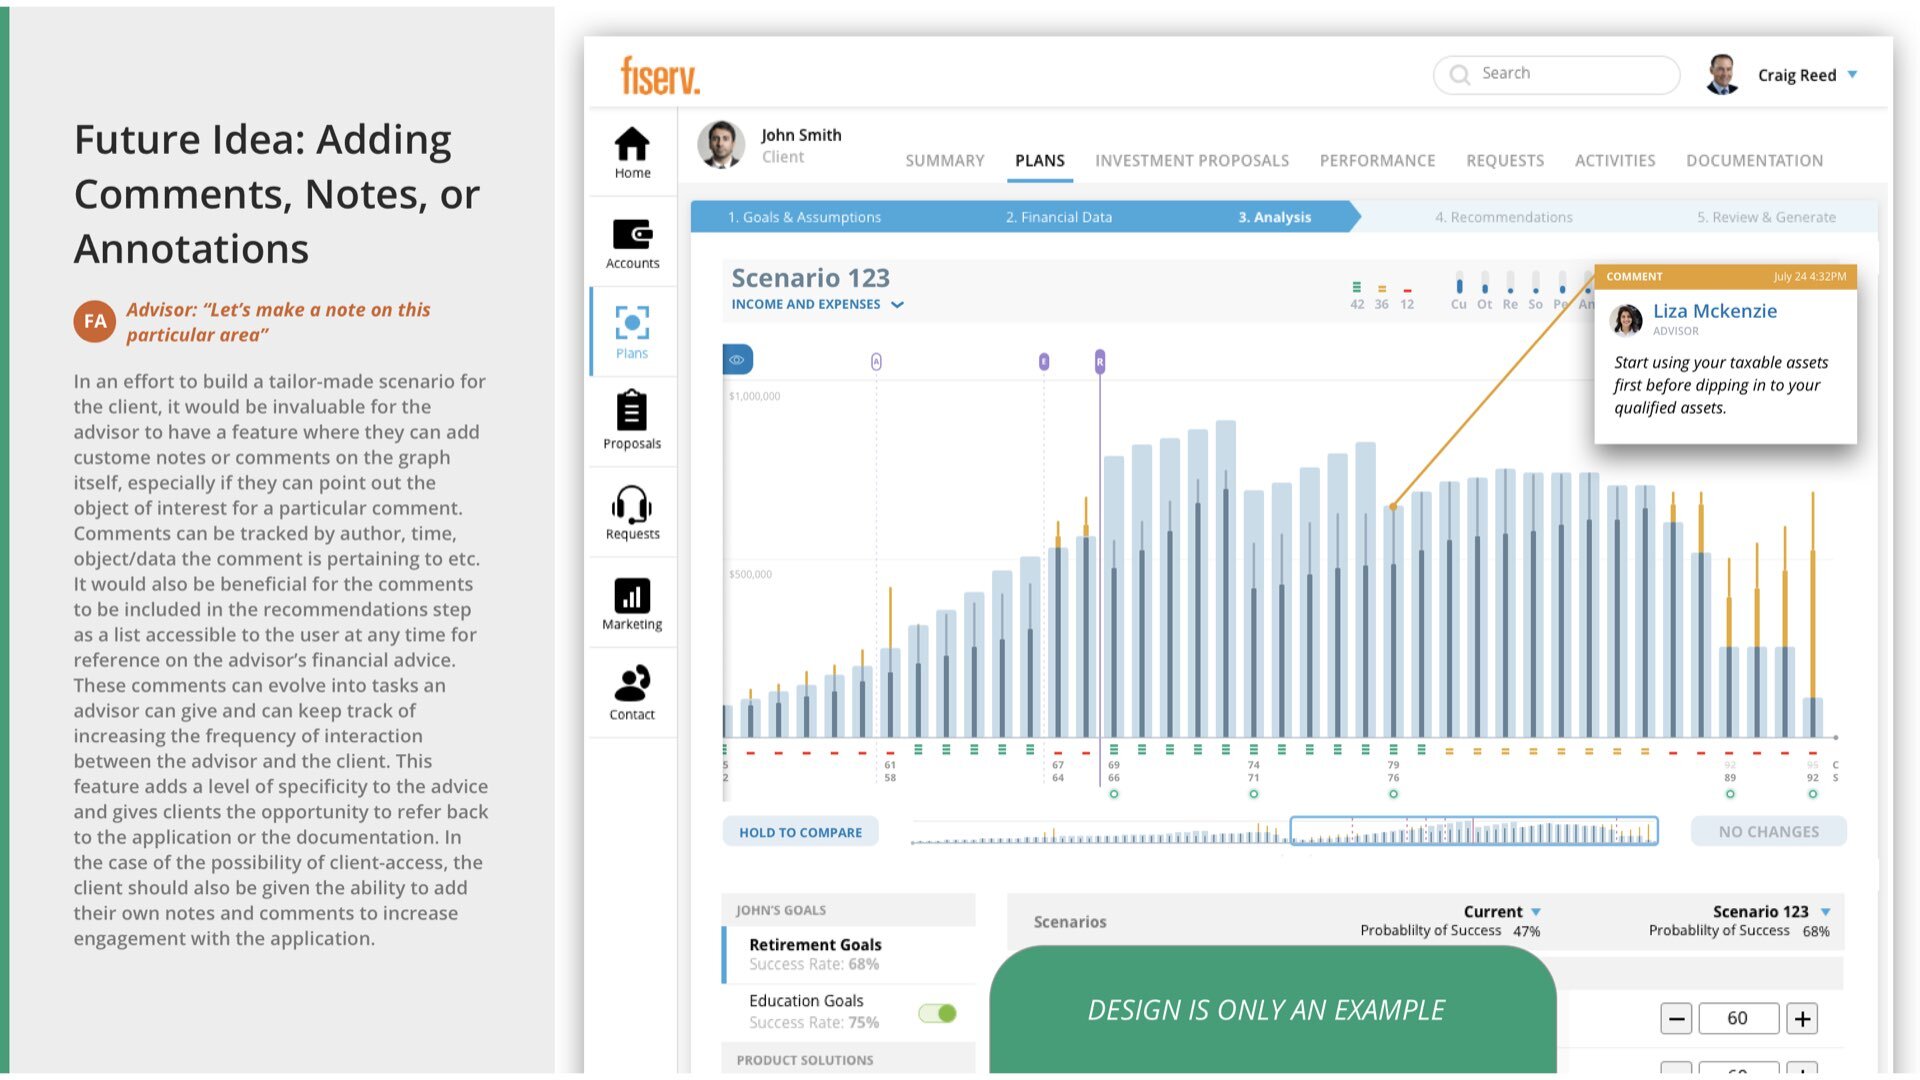
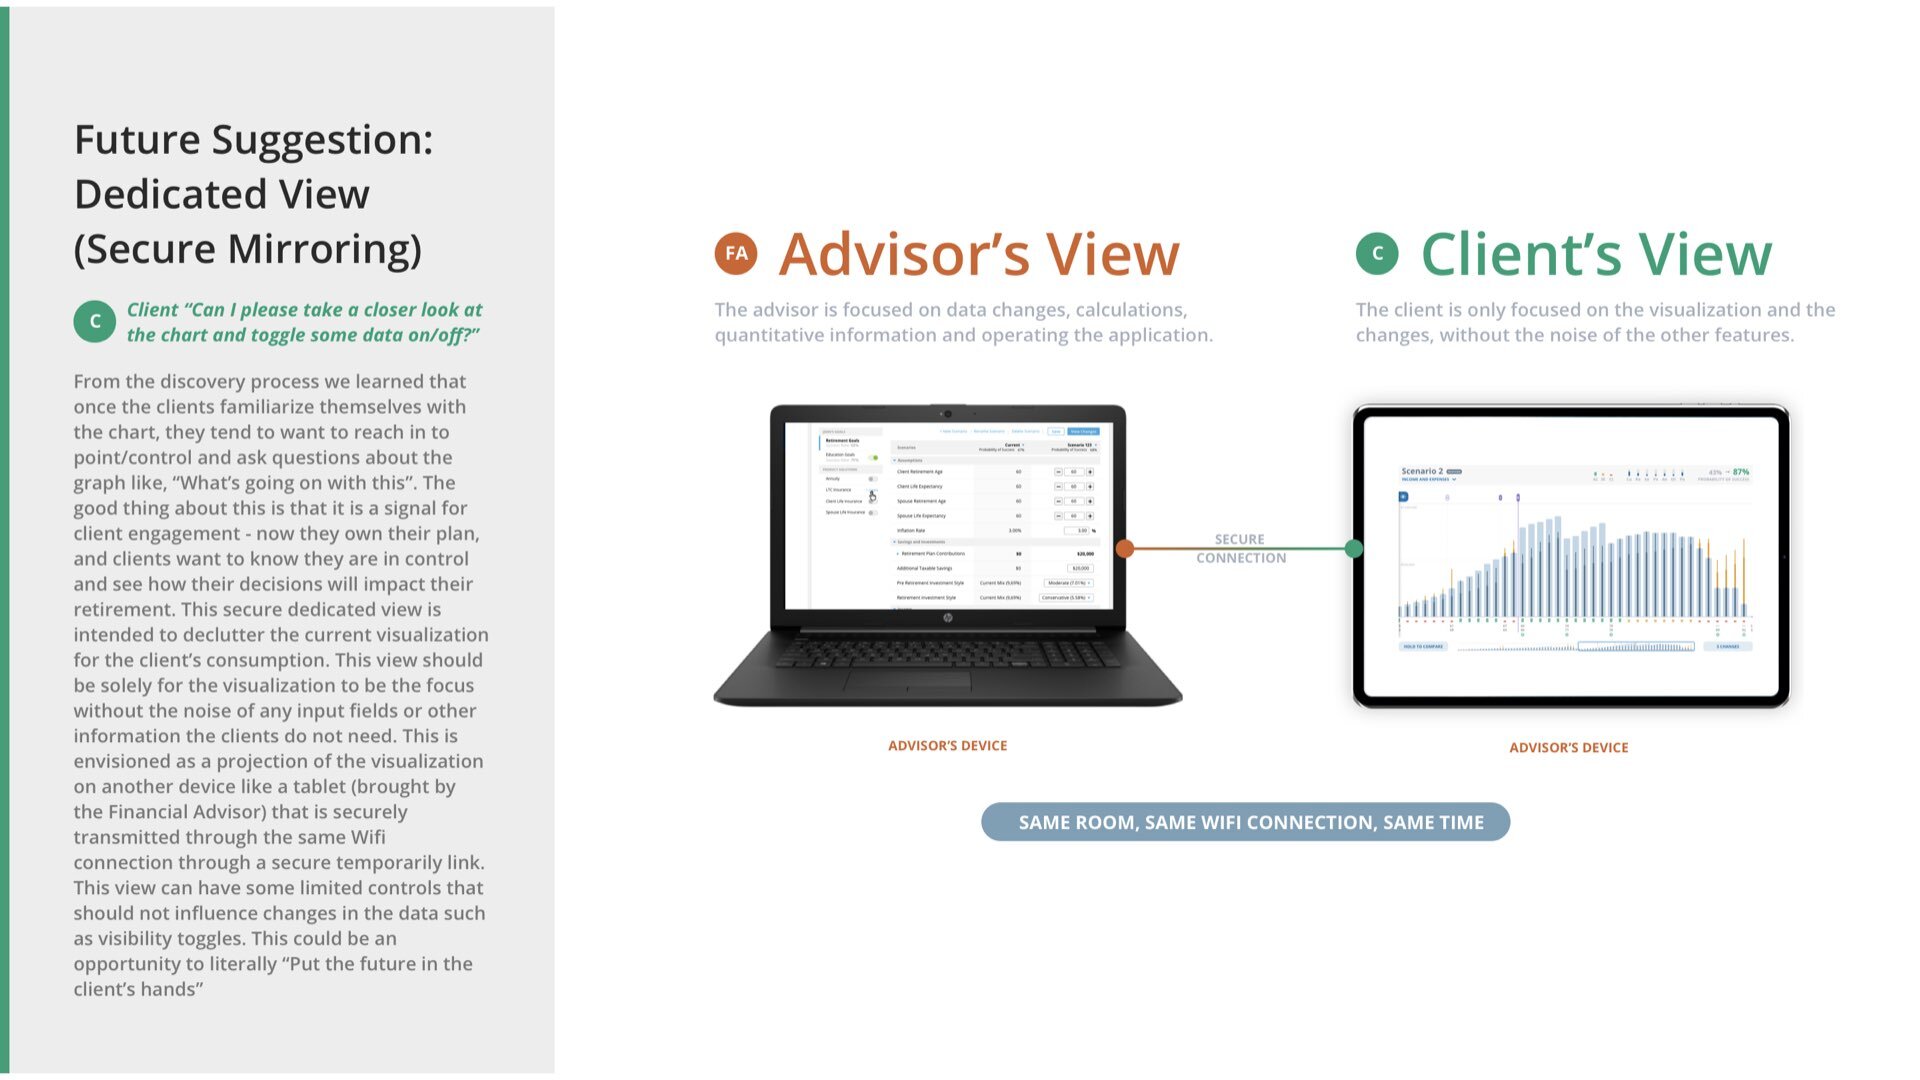
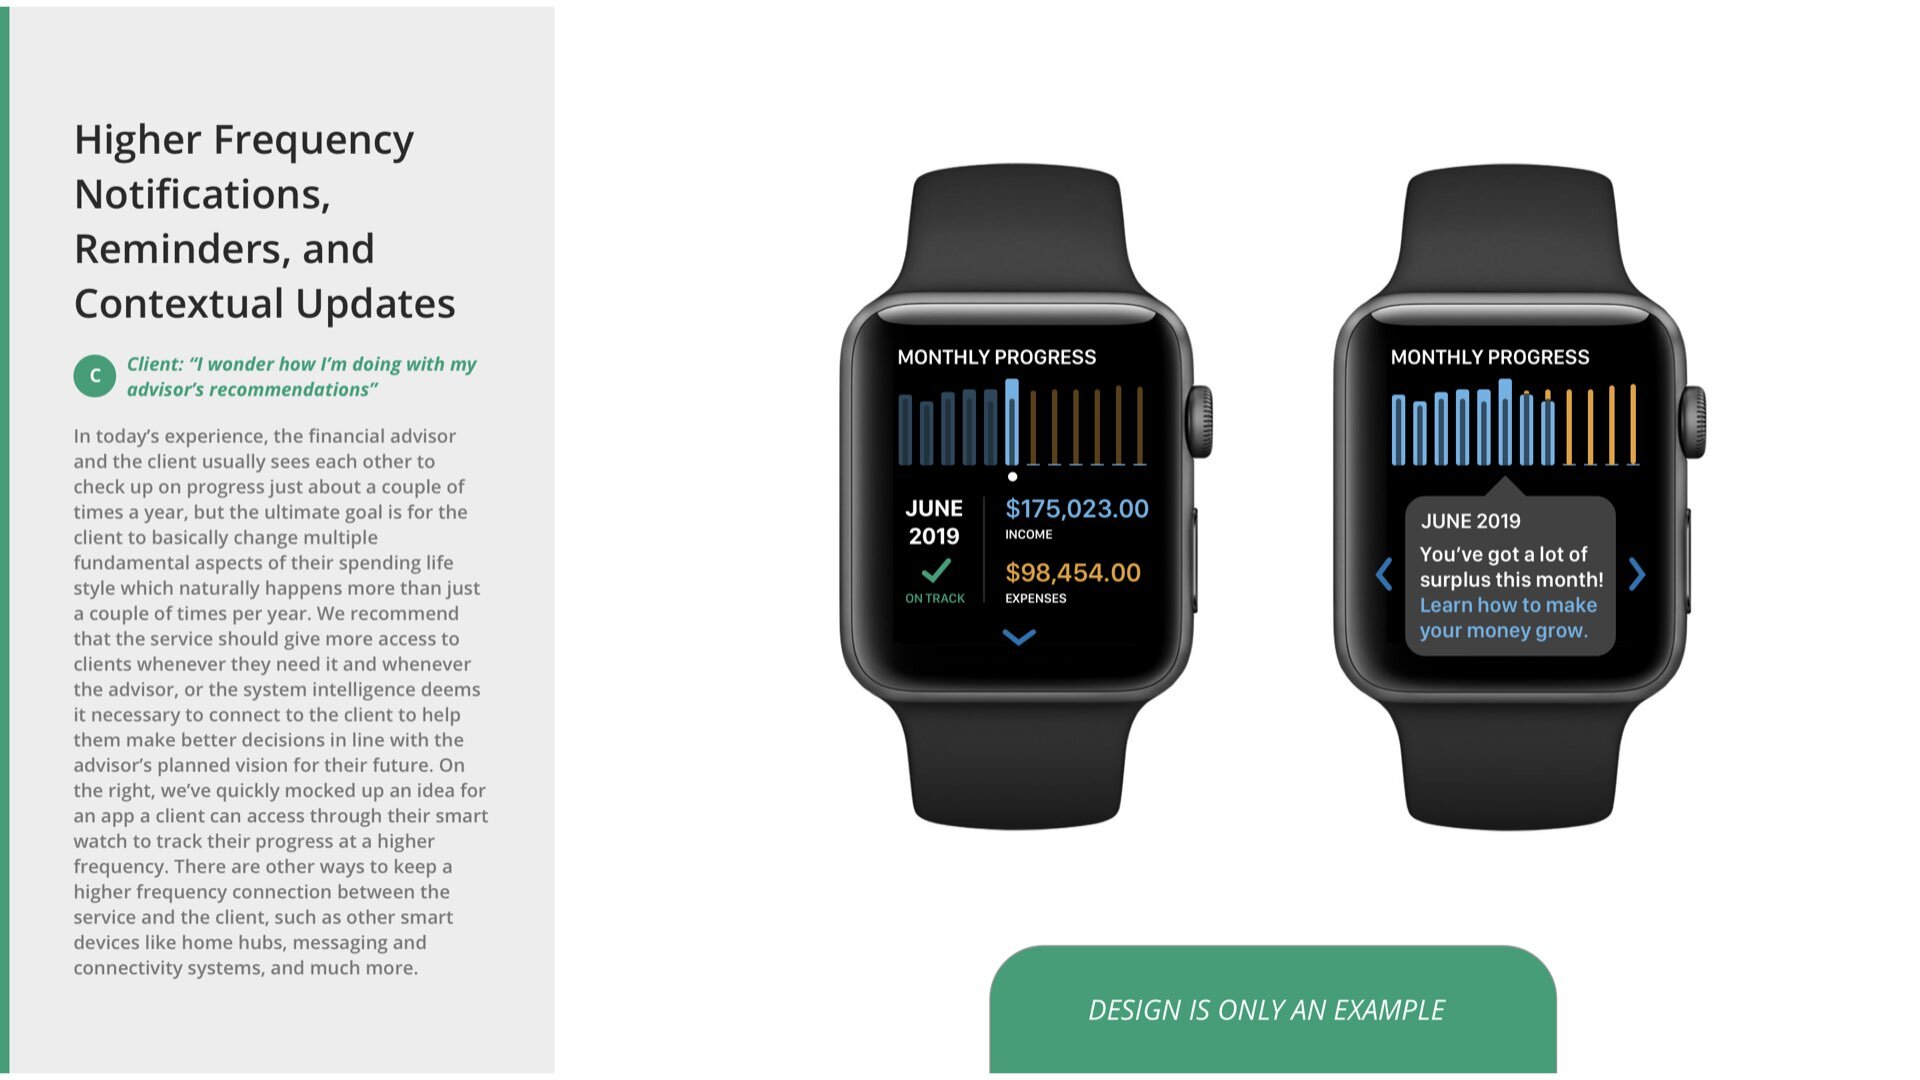
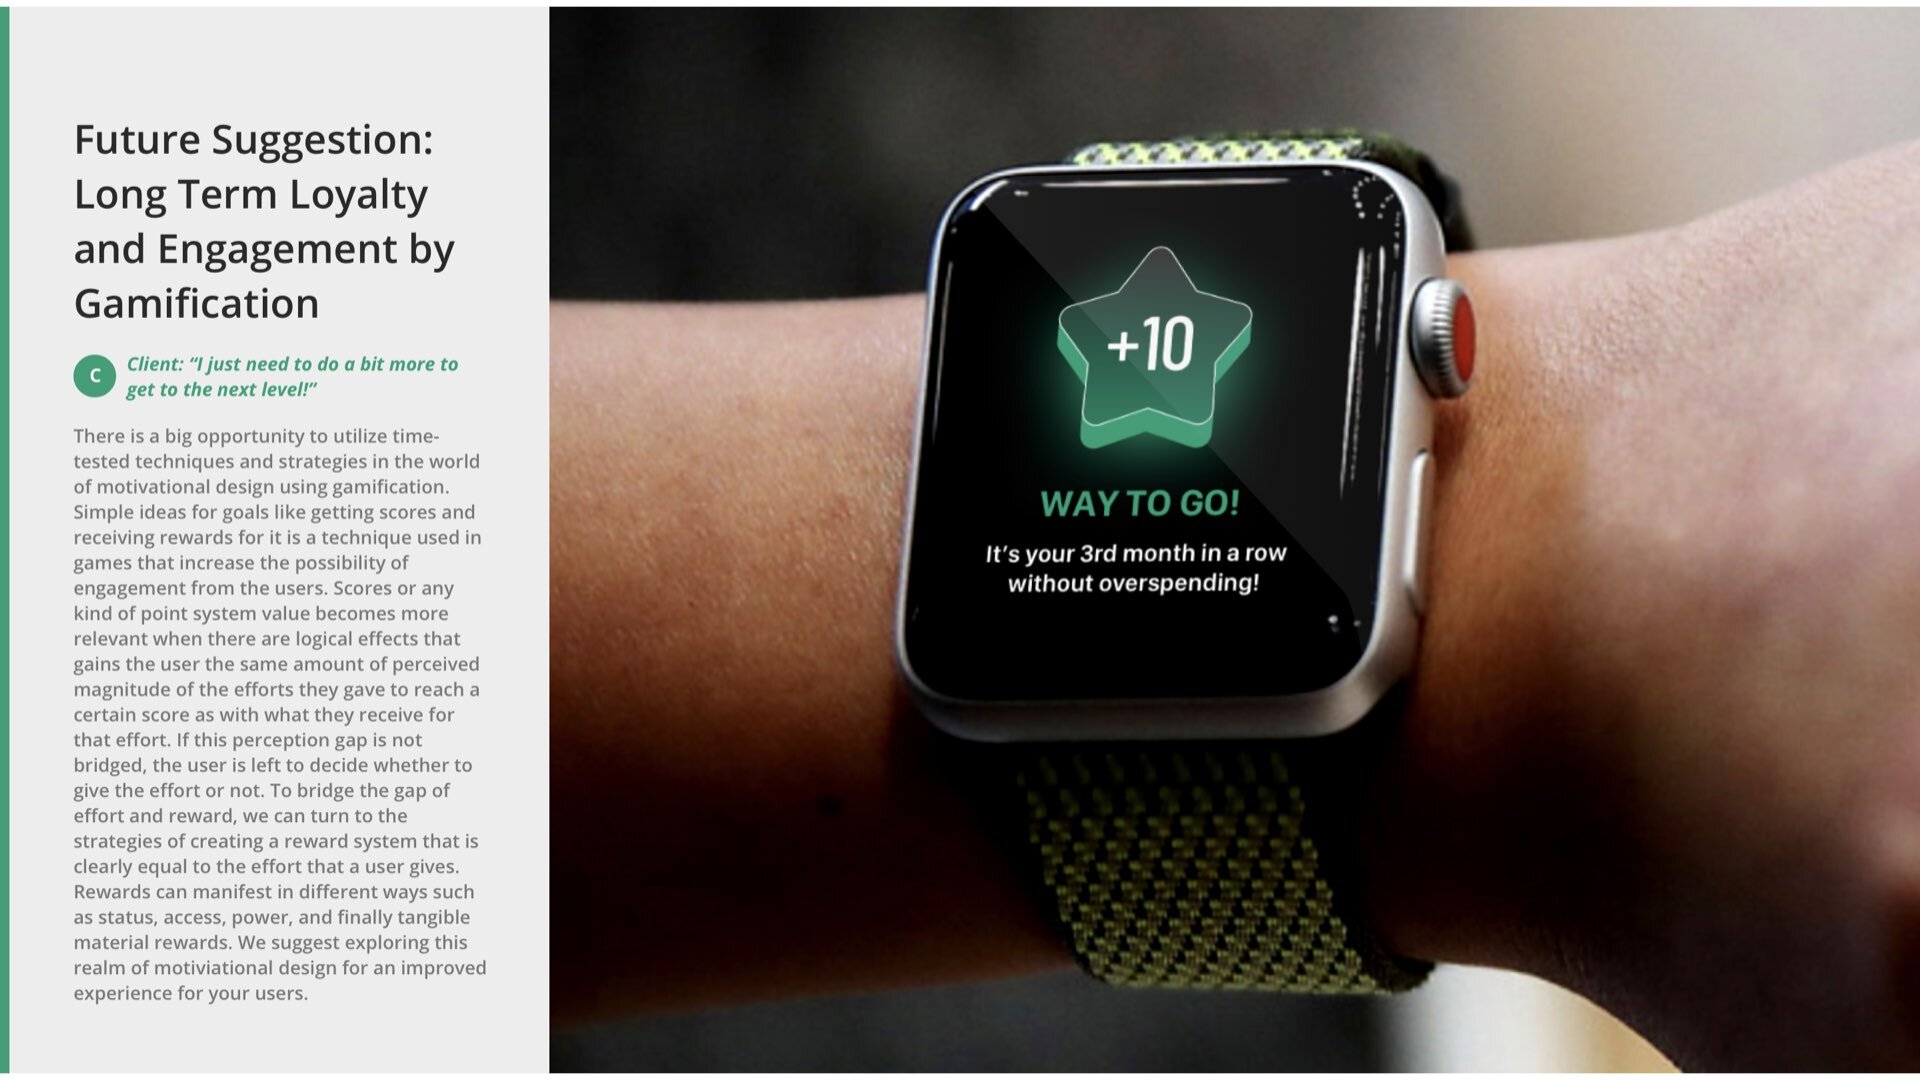
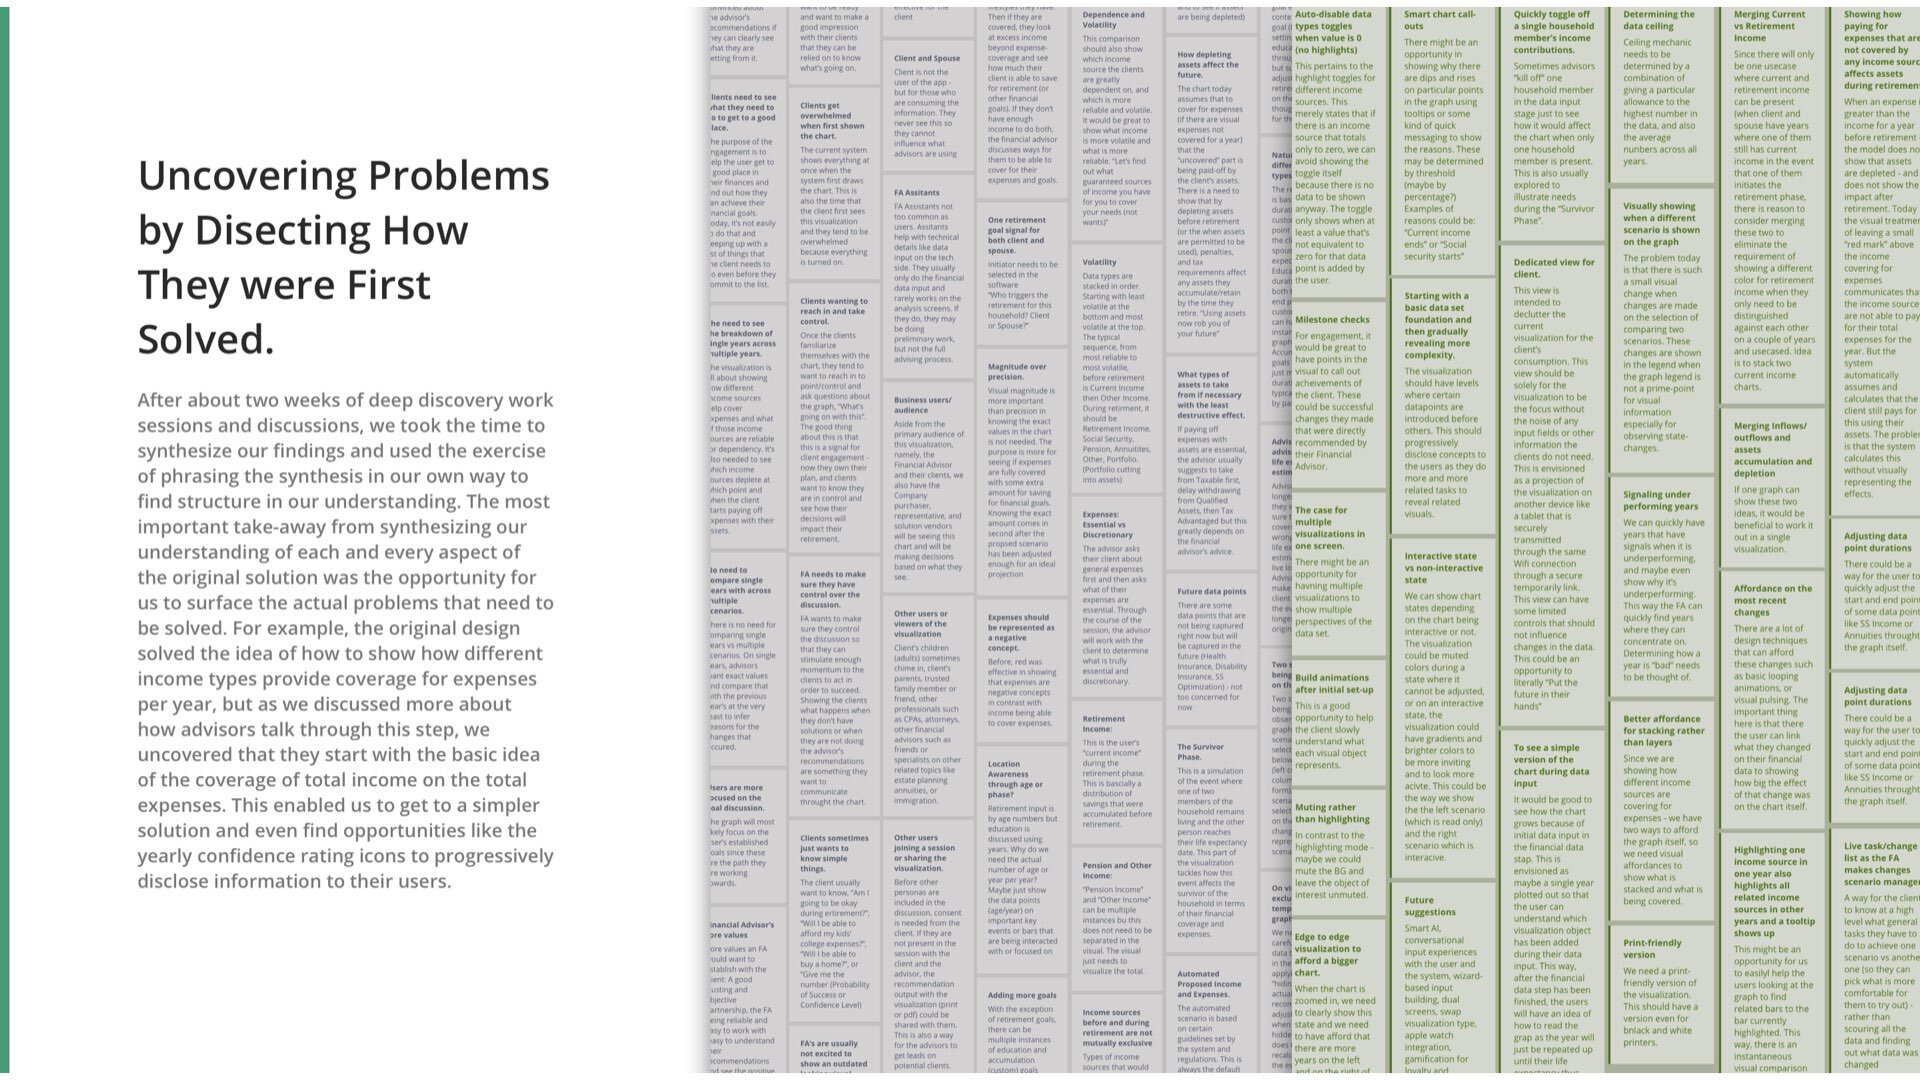
LOOKING AT THE FUTURE, SOLUTIONS BEYOND THE UI
Ideating on what else the client can do to improve the experiences can give them ideas on what to tackle next.
These ideas focused on taking out the requirement for separate input experiences and having the main visual as the primary interaction point, while utilizing other hardware experiences to enrich how different users would use the service.